Access Facebook user profile data with FB Login

,
Start your free, no-risk, 4 week trial!

Access Facebook user profile data with FB Login


Use Facebook user profile data to populate your analytics reports

visitor profile with gender from facebookHave you ever wanted to have in-depth details about your website visitors or app users?

If your users “login with Facebook” and login to your site with their Facebook credentials, you can access valuable profile data.

In this article, we will discuss and explain two topics

a) How to access Facebook visitor data and 
b) How to insert it this data into your Opentracker web analytics reports.

This data is available when a visitor/ user is logged in with Facebook login details.

Q: How does it work?
A: When your visitors login to your site or app with their Facebook identity, you collect user information which you can access via our api. This information can then be shown in the Opentracker reporting system, and populate Visitor Profiles.
Additionally, you can then search through all of your data to match or locate any visitors or variables that interest you.

Furthermore, note that due to the technical nature of this article, knowledge on javascript and Facebook api [1] are required. In this example, we will collect information on the visitor’s gender.

The Javascript used to collect visitor Facebook profile information


function login() {
    FB.login(function(response) {
        if (response.authResponse) {

            // connected
            console.log("FB.login connected");
            window.location.reload();

        } else {

            // cancelled
            console.log("FB.login cancelled");
        }
    },
    fbscope);
}

window.fbAsyncInit = function() {
    FB.init({
        appId: '123456789012345',

        // App ID
        channelUrl: '//staging.pdfmyurl.com/facebook.channel.html',

        // Channel File
        status: true,

        // check login status
        cookie: true,

        // enable cookies to allow the server to access the session
        xfbml: true // parse XFBML
    });

    // Additional init code here
    FB.getLoginStatus(function(response) {
        if (response.status === 'connected') {

            // connected
            console.log("FB.getLoginStatus connected");
            sendUserInfo();

        } else if (response.status === 'not_authorized') {

            // not_authorized
            // User logged into FB but not authorized
            console.log("FB.getLoginStatus not_authorized");

        } else {

            // not_logged_in
            // User not logged into FB
            console.log("FB.getLoginStatus not_logged_in");
        }
    });
};

function sendUserInfo() {
    FB.api('/me', function(response) {

        //console.log("my object: %o", response);
        var map = new OTMap();

        //map.put("username!", response.username);
        map.put("gender!", response.gender);

        OTLogService.sendEvent("user logged in", map);
    });
}

The above javascript code snippet is triggered when a user clicks on a login button on your website. When the user has logged in via the pop up window, and successfully authorized, a custom event is sent to opentracker [7]. Note the exclamation mark on the map key. This is the start of the journey to collect user information on your site. To learn more about what user information can be collected, please refer to the facebook api [8] [9] [10]. Here are a few examples from the facebook api [2] [3] [4] [5].

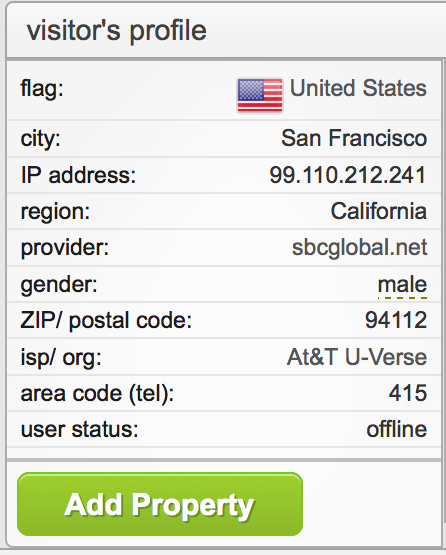
In order to see what data has been collected for your site, login to http://ot3.opentracker.net and navigate to visitor online and visitor clickstream. Below are screenshots illustrating the example from this article, implemented in the Opentracker reporting system. Please note that the gender has appeared in the visitor profile.

clickstream with gender and login status

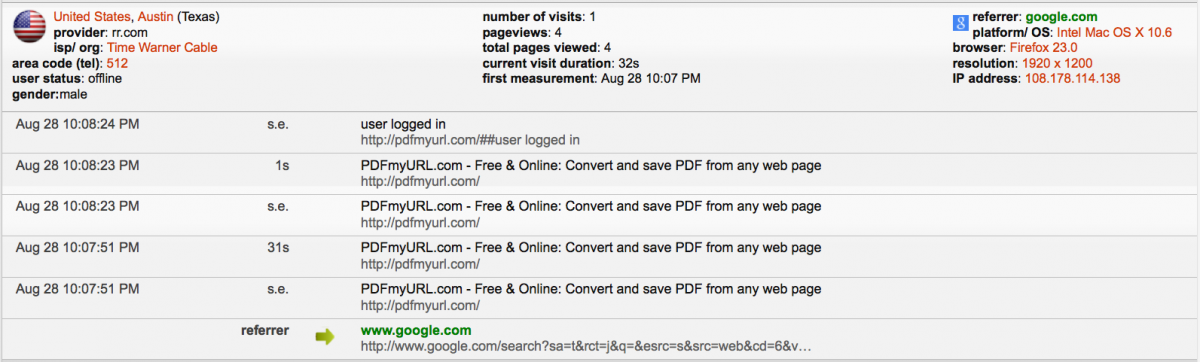
The illustration above shows us Opentracker visitor engagement reporting with clickstream enhanced visitor profile including a visitor gender.
full clickstream detail with gender and login status from facebook

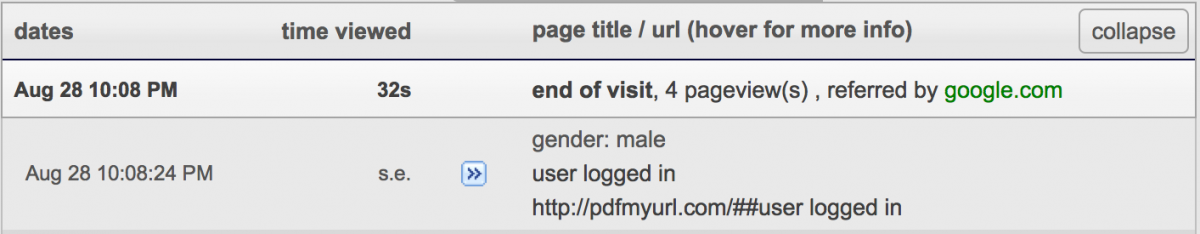
The illustration above gives us two pieces of information: the gender and the login status (login event), derived using a “login with facebook” event.

Full screen Facebook user-data in Opentracker clickstream

References

[1]  https://developers.facebook.com/apps/

[2]  https://web.archive.org/web/20200203213418/http://www.fbrell.com/auth/account-info

[3]  https://web.archive.org/web/20200129213616/http://www.fbrell.com/fb.api/does-like

[4]  https://web.archive.org/web/20171226151555/http://www.fbrell.com/fb.api/everyone-data

[5]  https://web.archive.org/web/20161106191718/http://www.fbrell.com/fb.api/friends

[6]  http://pdfmyurl.com/js/facebook.js

[7]  http://api.opentracker.net/api/inserts/browser/javascript_implementation.jsp

[8]  https://developers.facebook.com/docs/reference/javascript/FB.api/

[9]  https://fbdevwiki.com/wiki/FB.api

[10]  https://developers.facebook.com/docs/reference/javascript/

Blog & Articles

Blog & Articles.

We publish an ongoing series of blogs & articles on various topics related to digital analytics and online marketing.

What Web Metrics Can Do For You

, ,

What (exactly) web metrics can do for you. Fail to plan : plan to fail

Business is based on margins and profits.

In order to generate a specific profit X, there is a minimum amount of sales Y that need to take place.

Business forecast and managing a business rely on calculations. Whether or not costs are covered and sufficient revenue is generated should not be left to chance. Website and customer journey analytics are necessary to determine what is working, what is not working and how to ensure business health. Click to read about driving performance with customer journey.

In a nutshell: business and website managers need to stay on top of actual performance and make ongoing changes

Example

This is where statistics come in. For a web-based business the success of the business depends on a combination of several metrics:

  1. The amount of traffic that comes in
  2. The amount of traffic that converts
  3. The average, or total, value of the conversions
  4. Additional consideration is whether or not the revenue is recurring

The take-home is that these metrics need to be reverse-engineered to ensure that the business stays healthy and grows. Projections can be made based on historical data. Current data is then used to calculate revenue projections. Action can be taken if the numbers are not high enough.

Conversion rates tend to stabilise and do not change again, unless something else change – click to read how this works. In other words, if you receive on average 20-30 visitors per day, this will remain more-or-less constant.

Unless you increase or decrease the budget or change your marketing content you will receive a constant amount of visitors.

In a great many cases, the amount of traffic that converts (conversion rate) is also consistent or stable.

The point is that you can use metrics to:

  1. Reverse engineer (predict) how much revenue will be generated based on current and historical traffic.
  2.  Perhaps more importantly – know when the numbers are too low, when your efforts are not succeeding; and when you need to add or change traffic sources and marketing strategies.
  3. Businesses rely on predictability. Metrics measure what is actually happening and are used to calculate:
    • Predictions
    • Signals that additional actions to generate revenue need to be taken
    • Validation of continued attempts to generate both traffic and ensure that the traffic is converting. Especially as there are multiple sources of traffic, which needs to be measured per channel (see below).

The last point in this train of thought is that there are multiple channels (traffic sources) through which your customers journey:

  • New traffic
  • Existing (returning) traffic
  • Nurturing (newsletters)
  • Direct cold outreach emails
  • Blog posts and articles
  • White papers and downloads,
  • SEO campaigns with different vendors; Google, Facebook, Instagram, Linkedin, etc. 

The take-home is that (conversion) metrics and customer journey analysis tells you which of these channels are working and which data is essential to creating and managing success.

Power of Customer Analytics

, ,

Power of Customer Analytics

Today’s businesses are swimming in data. But, as any swimmer knows, it’s not enough to just be surrounded by water – you have to know how to use it to your advantage. That’s where customer analytics come in. Customer analytics is the process of using data to generate insights that can improve your business, increase revenue, and drive customer retention. 


There are four main types of customer analytics: descriptive, diagnostic, predictive, and prescriptive. In this blog article, we’ll take a closer look at each one, and explore how you can use customer analytics to improve your business.


Descriptive Analytics

Descriptive analytics answer the question “What happened?”


They provide a snapshot of what has already transpired, such as how many customers made a purchase last month, what was the average order value, or how long it took for a customer to make a purchase. Descriptive analytics are important because they provide a foundation for understanding the way your customers behave. This type of data can be used to identify trends and patterns, which can be helpful in forecasting future behavior. To generate insights from descriptive analytics, businesses need to have access to data that is organized and structured in a way that makes it easy to slice and dice. This data can come from a variety of sources, such as customer surveys, website analytics, transaction records, and social media data. However, descriptive analytics cannot tell you why something happened, which is where diagnostic and predictive analytics become valuable.


Diagnostic Analytics

Diagnostic analytics answer the question “Why did it happen?”


They help you identify the root cause of an issue, such as why customers are leaving your site without making a purchase, or why orders are being delayed. Diagnostic analytics use data mining techniques to uncover relationships and identify causal factors. This type of analysis can be used to improve processes, optimize performances, and resolve problems. Diagnostic analytics can be obtained through surveys, customer interviews, focus groups, and other qualitative methods where customers can provide feedback about their experience. Alternatively, services like Opentracker can provide website data that can be used to diagnose problems so you can improve the customer experience and mitigate issues before they cause long-term damage.


Predictive Analytics

Predictive analytics answer the question “What could happen?”


Based off of historical data, predictive analytics uses statistical modeling to generate insights about future trends and behavior. This type of analysis can be used to identify opportunities and risks, make decisions about resource allocation, and develop marketing campaigns. For example, predictive analytics can be used to determine which customers are likely to churn so you can take steps to retain them, or to identify which products are likely to be popular so you can stock more of them. To generate predictive insights, businesses need data that is clean, accurate, and complete. Having a team of experts onboard who are skilled in statistical modeling is also critical for this type of analysis. In-house data scientists can be costly, which is why access to our team of professionals is included in an Opentracker subscription so we can assist you in generating predictive insights and interpreting the results as your business grows.


Prescriptive Analytics

Prescriptive analytics answer the question “What should we do?” 


It’s not enough to know what happened in the past or what could happen in the future. To make data-driven decisions, you need to know what actions you should take to achieve your desired outcome. This is where prescriptive analytics comes in. Prescriptive analytics uses optimization algorithms to identify the best course of action, given a set of constraints and objectives. This type of analysis takes into account a variety of factors, such as costs, risks, and benefits, to help businesses make decisions that are in their best interest. With the right data in your hands, you can start to develop prescriptive analytics solutions that will allow you to automate decision-making and improve your overall efficiency.

No matter what type of business you have, customer analytics can be a powerful tool for driving growth and success. By understanding the different types of customer analytics and how you can use them, you can make better decisions, improve your operations, and move your business forward.


Opentracker offers a suite of tools and services that are designed to be user-friendly and scalable so businesses of all sizes can benefit from data-driven decision-making. We help you automate your customer journey reporting, uncover actionable insights, and make better decisions that drive real results. With direct access to our data analytics team, a dedicated customer success agent, and a dedicated database engineer, you can be sure that you’re getting accurate, actionable data you need to grow your business. 


Book a discovery call today to learn more about how Opentracker can help you turn data into insightful, actionable customer intelligence. 

Improving Customer Experience

, ,

How does deeply understanding your customer’s journey unlock revenue?

You’re in the business of satisfying your customer with a great experience. But how do you know if you’re delivering?
 
customer experience

Businesses are spending more on promotions than ever before, but most struggle to know what actions to take and where to focus their efforts.

When customers don’t buy, do you know why? Can you improve the buying experience? The marketing? Differentiate the product? Without an idea of what your customers are feeling or how they are engaging, it’s hard to make informed decisions.

Privacy laws are making it clear that it is important to collect your own data related to your own customers. Trusting third parties like Facebook or Google to give you these insights is now a significant risk. More and more businesses are choosing first party solutions.

Getting sales is great, but how many sales are you losing because you are not seeing bottlenecks in the customer journey? Knowing what delights and discourages your customers is next to impossible without controlling your own data.

Customers have 5 touchpoints, sometimes spanning days or weeks, before making a purchase and you following up. Are you measuring these touchpoints to increase conversions?

Moving The Needle And Driving Revenue

Not tracking your customer’s journey is like tossing money out the front door.
For any business, tracking the customer journey is essential. As Peter Drucker said “If you don’t measure it, you will not improve it”. All too often, you’re forced to guess how your customers will buy. You don’t know what’s working and what’s not. Consequently, you have no idea what to optimize. You’re wasting money.

You should guide customers through their journey. Provide support when they get stuck. Learn what makes them leave and why you can’t close the deal. Don’t rely on just Google’s or Meta’s report.

Track The Customer Journey. Own Your E-Commerce Dashboard.

Customer Journey by Opentracker makes it easy to control the customer’s journey. We help you get a clear picture of how you can improve what you’re doing – and where you need to make adjustments. The result? You get more sales.

Our platform helps track customer behavior and delivers essential insights. Whether it’s tracking new leads and acquisition or understanding retention and the factors that drive repeat purchases. Customer Journey provides clarity and actionable insights that boosts your ROI.

With Customer Journey, you will get the data insights you need faster, more reliably, and at a fraction of the cost. Our team is dedicated and knows how to work with e-commerce businesses. Our consultants will be there to make sense of your metrics so that you can make data-driven decisions.

Delight your customer. Happy customers pay more, more often.

Learn how Customer Journey by Opentracker can help boost your sales!

Click to book a discovery call today:

Schedule A Call


The Customer Is King – Busting The Myth

, ,

The Customer is King – Busting the Myth

Bad Clients

Clients are the lifeline of any business as demonstrated by the adage “The Customer is King”, — a corporate mantra that places the client at the center of business success. 

customer is king

Prominent gurus encourage businesses to  shower their customers with attention and pampering. As a result, most businesses find it hard to say “no”. Bad clients can wreak havoc on your business. Metrics such as the cost-per-acquisition (cpa) or the average time spent will suffer.

The best defence? Ensure that your business is not attracting bad clients to begin with! 

How do we do this? By understanding your online customers’ behavior, making informed business decisions backed by reliable data, and tailoring your marketing and buyer journey to ensure the right message is conveyed to the right audience at the right time.

The first step is to build a selection of ‘bad client avatars’ and avoid them in future. The following are examples of the types of bad clients to avoid.

The “Unreasonable”

Unrealistic expectations or demands. Never satisfied. Very challenging. “Unreasonables” put pressure on your resources and drain morale.
Tip: it’s important to set realistic expectations in the buyer journey so the potential buyer knows what to expect. Buyer journey insights will help accomplish this.

The “Low-Baller”

Low-Ballers are looking for the lowest price possible. They are not interested in quality or value and are frustrating to work with as they are only interested in the cheapest options. Identify your target market’s income bracket and ensure that your ads and content target your market.

The “Flake”

When you’re marketing your business, cost-per-click is everything. Avoid attracting clicks from people who are not interested in your product or service. Flakes are time-wasters who click on your ads without any intention of buying anything. They might be curious, or they might just like clicking on things. Flakes increase your cost-per-click without bringing any value to your business. The best way to avoid attracting Flakes is to create ads that are relevant and targeted to your ideal buyer persona. If you’re attracting a lot of clicks but not getting many conversions, it might be time to reassess your targeting strategy.

Opentracker allows you to identify the types of clients who are visiting your website and understand their behavior in real time. This insight empowers you to optimize your strategy and buyer journey to ensure that you are attracting the right kind of attention from the right people. Bad clients can have serious effects on your business, so it’s important to be able to identify them early on. By using Opentracker to understand your online customers’ behavior, you can make sure that you’re doing everything you can to weed out bad customers, improve buyer experience, and increase your conversion rates.

Click to book a discovery call today!

Increase the bottom line with Offline Attribution Metrics

, ,

Increase the bottom line with offline attribution metrics

Offline attribution has always been a measurement challenge. We use the example of a company we work with; StudyPoint, founded in Boston in 1999, deliver consistent and reliable academic and test prep results to families alongside individualized needs assessments and online homework tools.

By ‘offline attribution’ we mean the measurement of an important event that takes place offline.  For clarity: this as opposed to online events which are relatively simple to measure: ad clicks and campaign clicks are easy to collect through utm tagging Other examples of online touchpoints which can be measured are: contact forms and sign-up or login events, downloads, webinars, podcasts, and app visits. 

The most common examples of outreach which are difficult to measure are telephone calls, billboards, radio magazine and newspaper advertisements, and direct conversations at conferences and events. 

It is important to know how these types of outreach perform because knowing what is effective determines budget spend. Without insights, there is guesswork involved.

The problem is that, if at any point in the workflow, an offline activity takes place, this disrupts the entire measurement flow. Specifically the ability to attribute success (conversion) to a channel (source and medium). Another example is knowing which materials are converting visitors prospects or leads. Read about conversion and ROI here.

The goal in attribution is to measure which marketing efforts are having the best effect. This information tells you how to allocate your Marketing spend.  

For this article, we have chosen an example of a company for whom we designed a workflow that takes offline attribution into account and delivers a KPI-metric that can be measured.  Please get in touch with us if you would like to learn how we can solve this problem for you. 

Our case study involves a company that provides tutoring for children. StudyPoint is in the business of helping kids achieve their academic goals through personalized, one-on-one tutoring programs.

In this case one type of client (the parents) make arrangements for children (end-users). So there is immediately some complexity as there are a minimum of four parties involved (StudyPoint team, parents, students, tutors).

Because it’s a high ticket offer and the parent/ caregivers want to know who is tutoring their child, one or more phone calls take place. 

In terms of conversion, during the phone call the payment details are arranged. Once the offline event, i.e. the phone call, has taken place, the measurement of touchpoints can resume. 

Solution: we designed and deployed a seamless workflow to capture all activities and generate automated reporting. 

Understanding Customer Journey vs Buyer Journey Can Affect Your Bottom Line

, ,

How Can Understanding Customer Journey vs Buyer Journey Affect Your Bottom Line

The difference between Customer Journey vs. Buyer Journey can best be summed up as: The difference between Attraction and Retention.

The Buyer Journey is all about the steps a person takes before making a purchase.

The Customer Journey is about developing a relationship or customer experience with a person after purchase.

The word ‘journey’ is relevant for both customers and buyers.

The Customer’s Journey starts when the Buyer’s Journey ends.

A good analogy might be a race track. You run a race and you win a buyer. Now you running around the same track, win another race and sell something more to that customer.

Can it hurt your bottom line to not understand the difference? Of course. The big secret is that it costs more to gain a new customers (CPA – cost-per-acquisition) than to keep existing clients, both in terms of money and effort.

Heck, if you do your math right, you can even make a loss with your first sale to acquire a customer.

Think of it as running another lap around the track just one more time, instead of learning a whole new sport.

The point is that we are always on the lookout for the next campaign or promotion. Looking for new customers. It is tempting to keep thinking of new hooks and pain points.

Looking for new customers and keeping existing buyers engaged should both keep happening. But keep in mind that they are different funnels and require different strategies (call to action, offers, pricing, etc.).

Bottom line: approach these two types of engagement differently, be aware that they exist and require different hats.

Want to know how to differentiate the buyer journey from the customer journey? Click below to book a complimentary strategy session.

Schedule A Call

customer journey


3 Customer Metrics That Increase Profits

, ,

3 Customer Metrics That Increase Profits

Remember that first sale? The hard work to make it happen?

Every purchase is the start of a customer journey. It’s the buyer’s vote of confidence for your brand.

Part of the brand’s experience is servicing this journey. The more perceived value provided, the more profits made!

The customer journey nurtures and improves the customer relationship. Knowing which metrics to track and leveraging this data will help you optimize the journey, increase perceived value and leverage profits.

Today I’ll take a look at three metrics you’ll want to track. By tracking these key indicators, you’ll be able to build strong, fruitful and lasting relationships.

1. Customer Churn Rate

Your customer churn rate is the percentage of customers who stop doing business with you. Reducing churn can dramatically increase profits.

Churn can be a symptom of poor customer service, a change in their personal circumstances or simply finding better deals. Understanding the reasons behind churn will increase profits. Do you have a process in place to monitor and reduce churn?

2. Customer Lifetime Value (CLV)

Your customer’s lifetime value (CLV) is the total amount of money a customer spends with your brand over the course of their journey. It determines how much you can spend to acquire and retain customers.

There are a number of factors that contribute to a customer’s lifetime value, such as purchase frequency, the average order value, and the length of time they remain a customer. By understanding your CLV, you can make more informed marketing and sales decisions that are focused on acquiring and retaining high-value customers.

3. Net Promoter Score (NPS)

NPS measures how likely your customers are to recommend your brand to others. How satisfied are your customers?

NPS is calculated by asking customers to rate their likelihood of recommending your brand. Customers who respond with a score of 9 or 10 are considered to be “promoters”, while those who respond with a score of 0-6 are considered to be “detractors”. The scores are then used to generate an overall NPS score, which can range from -100 to 100.

How to Use These Customer Metrics

Customer metrics will help improve the bottom line.

Take a look at the churn rate. Are you losing customers? Find out why. Counterintuitively it might be as simple as *raising* prices.

Next, take a look at the lifetime value. What are ways to increase the lifetime value? In a competitive market, the player with the highest lifetime value wins.

Lastly, look at your NPS score. If your scores are low, improve the customer experience. Can you improve the communication touchpoints or train the staff?

Add these metrics to your or your partners marketing dashboard and meet the goals.

How To Drive Business Performance Using Customer Journey Analytics

, ,

How To Drive Business Performance Using Customer Journey Analytics

Want to get more profits by focusing on the Customer Journey?


Certain technologies allow marketers and business owners to measure activity across multiple touchpoints. 

Analytics, tracking, and web stats have been around for decades but only recently can business owners focus on their most important asset: the customer. 

By stitching all metrics together you’ll be able to focus on the customer’s behavior.

Think of a KPI that needs improvement? Get the metrics setup in a dashboard and start working towards your goals like reducing churn, driving upgrades or increasing customer satisfaction – i.e. increase profits.

Are you curious about what helps most?


Start by measuring every visitor who comes into contact with your digital presence. Measure and combine all their behavior. This includes website behavior, clicks, logins, downloads, sign-ups and forms, as well as email and newsletter opens. Work to create a single view of the customer across all your channels.

Additionally, this information can be used to visualize flow in the Customer’s Journey.


The goal of your business is to help the customer on their journey to get dream results, with minimal risk, as fast as possible with minimal effort. Imagine that.

Start measuring KPIs that help the customer do this and start driving your revenue up.

The main actions are:

  1. Identify crucial steps 
  2. Be able to zoom in and drill down 
  3. Identify  touchpoints that have big emotional effects
  4. Reverse engineer outcomes to leverage predictive analytics
  5. Promote content that brings in ideal candidates
  6. Eliminate content which generates unqualified traffic
  7. Automate the parts of the funnel that work
  8. Have sales and marketing focus on optimizing the journey 
  9. Get main insights into a dashboard
  10. Continually improve by eliminating bottlenecks