Why Your Search Terms on Google Don’t Show Up, and What You Can Do About It

Why Your Search Terms on Google Don’t Show Up, and What You Can Do About It

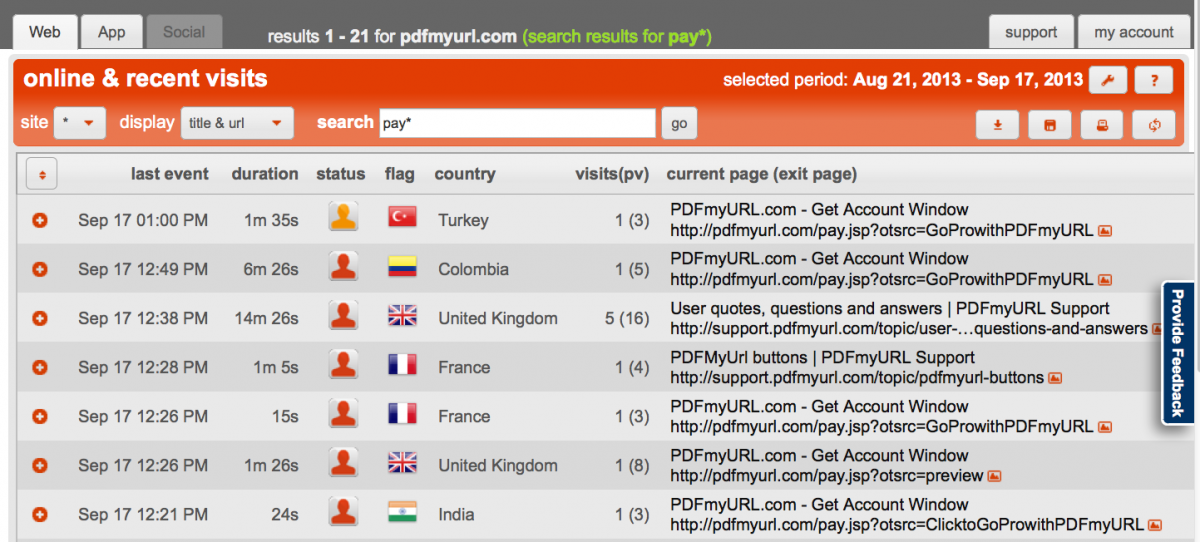
There used to be a time when it was possible to log into analytics tools such as Opentracker to see a wealth of data about keywords; specifically, the keywords people used to find your website. With this information you could then track conversions, and make improvements in areas that would be the most profitable. Why, then, do you see so few search terms in your Opentracker dashboard?

The first thing to say is that this is not an Opentracker issue. If you use any other analytics software, you will encounter the same thing – hardly any keyword data. The reason is that Google doesn’t divulge the information anymore. It used to, but that all changed when it started encrypting searches.

Basically, this means a huge number of searches done on Google use secure search. When the search is over a secure connection, Google doesn’t make data on the keywords used available to the website. Your analytics provider can only process data that your website has, and if Google isn’t giving it to you, it can’t be shown or used in analytics platforms such as Opentracker.

The keywords affected by this are often referred to as “not provided” keywords as this is the only information that Google gives you, i.e. it is not provided.

This change in Google’s policy began in 2011 when it encrypted searches for users who were signed into their Google account as well as some searches conducted on the Chrome web browser. In 2013 it expanded the policy to cover even more searches, including searches done in the Firefox web browser.

In statements Google has cited privacy as its reason for the policy – protecting the privacy of people conducting searches. It also predicted that the impact would be minimal to the point that it would affect only a small minority of searches. For most websites this prediction has proved inaccurate as the majority of keyword information is held back by Google. In other words, “not provided” keywords often account for more than 50 percent of the keywords you find in your analytics tool.

Getting Around Google’s “Not Provided” Keyword Problem

Whatever analytics tool you use, there is no easy method of getting around Google’s restrictions to get information on the keywords people use to find your website. Most people involved in digital marketing have given up on that strategy and instead tackle the problem from a completely different angle.

The core of the different approach starts with the objective. The objective of using keywords was to improve your website in order to attract more visitors and increase conversions. Keyword data was handy because with that information you knew where to focus your efforts.

Your new strategy should seek to achieve the same objective – improving your website to attract more visitors and increase conversions – by using a different tool, i.e. not keywords.

One way is to display your products or services in smaller groups using multiple pages. You can then monitor which of these pages (or product groupings) gets the most traffic. That is the one that is probably doing best in search.

You can also use social logins to your website. When a person logs into your website using their Facebook or Twitter account, you will get access to data that you can use to tailor your message and improve your website. To make this strategy work you will usually have to offer an incentive for the visitor not only to sign up, but also to give you access to their social media account. Giving away free content – such as an eBook or white paper – is a method that many businesses have successfully deployed.

The bottom line is that Google’s restriction on keyword data is here to stay, whatever its motivation for the encryption policy. To get the most out of your website you should largely forget about keywords and instead use different data points and measurements to learn about how people engage with your website. This will allow you to make more informed decisions on how to improve it.

Start your free, no-risk, 4 week trial!

“Google search” through all your traffic data

“Google search” through all your traffic data

Start your free, no-risk, 4 week trial!

We have released an incredibly powerful feature only available in Opentracker:
easily search through all your visitor traffic data in realtime.

Q: What does that actually mean?
A: that means you can enter any search term that interests you and get results based on all your site content and your complete visitor history within seconds.

An example of universal search, demonstrating how to search through website visitors.

In the screenshot above, we have used “pay*” to locate recent conversions for the PDFmyURL website-to-PDF service.

In practice, this means that you can enter any search term you can think of and get results.
Examples: any word, page title, url, term, conversion, user, company, ip address, or strategic point of interest.

We’re nuts about data!

You may ask yourself why you have never used or seen this feature supported by any other web analytics companies before? The answer is that it was a very complicated nut to crack.

Opentracker: don’t get left behind.

Identify and track your visitors

User Behavioral Analytics

Goal-oriented User Behavior

Start your free, no-risk, 4 week trial!

Visitor Goals

Take-home message: visitor website behavior is goal-oriented. People who visit websites are usually trying to accomplish something. Your job if you work on a website is to facilitate this. There are some essential questions to ask;

  1. What are people who visit your website trying to accomplish?
  2. What are you doing to understand them?
  3. What are you doing to help them?

By studying traffic statistics for the past ten years across thousands of sites we have learned that website behavior is increasingly goal-oriented. In the past people seemed to do more surfing for “fun” – for example visiting company websites out of curiosity.
No-Brainer: Use traffic information to improve your website.

Q: What should you do with this insight?
A: Reverse engineer your website from a user-experience point of view. What does this mean in plain language? Figure out what people are trying to do, make sure they can do it quickly and easily. This applies to improvement of an existing site or creation of a new website.
How-to: improve visitor experience and likelihood that visitors acheive their goals

  1. Know what goals your visitors have
  2. Focus what you are offering – provide what people want
  3. Reduce the amount of clicks needed
  4. Make the process easier for them

Surfing behavior and the average amount of time people spend on website pages has changed. The vast majority of internet pageviews last 1 or 2 seconds. Writing on the internet evolves to reflect new reading habits. Many changes have been understood using website statistics. News websites are a good example. Look at the formatting on BBC, CNN or Yahoo. These sites continously re-invent themselves based on how and where people click, and how long they view. These websites base their design on the behavior of millions of daily visitors using traffic statistics.

Pages of text have been replaced with paragraphs. Paragraphs have been replaced with sentences. Pages are being re-designed to meet specific steps visitors make to reach their goals.

Part 1 of this article, above, is concerned with creating a website that helps visitors achieve their goals, next are webmaster goals.

Webmaster Goals

A Webmaster Goal is a goal that people who build websites want to encourage, for example signing up, making a purchase, or requesting information.

Encouraging your visitors to convert to your goals
Website designers build sites that encourage visitors to take certain actions (goals). Advertising campaigns are measured in success by the number of goal conversions which take place.

Combine goals for greater success
Action point: combine visitor goals and webmaster goals where possible.

  1. You want your visitors to convert to your goals
  2. Your visitors are trying to accomplish their own goals
  3. Find the overlap between these two activities and win-win

Increase the likelihood of goal conversion 
Strategy from the business point of view: every website has goals. Websites can be reverse-engineered in order to make sure that visitors are led to the goals.

How can statistics be used to increase goal conversion?

  1. Stats can be used to examine Goal Conversion scientifically and determine how to increase goal conversion likelihood &
  2. Visitor behavior, specifically in terms of how visitors find a website; the search terms typed and referrers used can be utilized to grow trends. For example, generating content related to most-used words, topics, and terms on the internet.

Conclusion

based on traffic and clickstream data we know that, more often than not, people are trying to accomplish a goal when they visit a website. Visitor statistics play a central role in increasing website performance and value. As a business, the easier you make it for people to accomplish their goals, the more visitors you will have, and the happier these visitors will be. In other words, the greater likelihood that they will return.

Glossary:

Conversion
Goal
Source
ROI

Identify and track your visitors

Understanding Big Data

Understanding Big Data

Start your free, no-risk, 4 week trial!
Executive summary and article navigation

Part 1: Introduction – Age of Big Data

Picture the Second Coming of the Internet, we are just entering the 2nd inning. The whole point of the discussion, and of Big Data, is how to ask the data questions. The data is only valuable if it is used to make decsions.

Key points:

  • The key is to understand data as it is; unstructured, using a scalable platform for analysis, processing, and action, in order to unlock value
  • Businesses wishing to remain competitive must continuously learn how to use technology to give meaning to the data they collect
  • Online customers generate a lot of data (data trails) which, combined with social media can be used to add value, generating leads and sales
  • Effective decision-making should be based on current real-time data
  • Information loses its value quickly and should be used efficiently
  • Keeping up with demands of changing clients and conditions requires a structural solution (like real-time management and utilization)
  • Scale is rapidly increasing: the current internet environment is millions of users and associated data-points managed by large websites, combined with round-the-clock smartphone activity, and still growing
You can read a summary of these points in our blog post on Unlocking the Value of Data.

Definition of Big Data

Wiki tells us: “In information technology, big data is a collection of data sets so large and complex that it becomes difficult to process using on-hand database management tools or traditional data processing applications.”

In other words, more data than ever before is available as more people & things are connected via internet.

What Opentracker does to solve this problem

In a nutshell; we’ve built a distributed database system that will collect and store anything you throw at it. In keeping with our tradition of simplifying things, we’ve got a powerful api you can use to ask the data any questions you like. Click here for the Opentracker api.

An endless stream of data

An example would be a program to manage exercising. Sounds simple enough, but think about all the data: the individual accounts and separate datastreams; every step taken, start times, finish times, distances, average speed, calories burned, sessions, temperatures, weight, BMI calculations, milestones, etc. Now imagine that every piece of data is a single entry/ signal, every footstep shouting “count me” until there is a tremendous amount of information in a very short time. It takes a large effort to collect, store, manage, maintain and keep this data available.

Tsunami of analytics

There is talk of data scientists, map reduce, hadoop, and big data analytics.

With so many people uploading endless streams of fotos, videos, music, content, consumer choices, likestweets, and chatter into the cloud, it is no wonder there seems to be too much information to act on. This is sometimes referred to as a ‘Data Tsunami’ – the fact that a datastream for even a single user via social media such as Facebook, Instagram, and Twitter, networking via LinkedIn, or a consumer site such as Amazon contains innumerable pieces of information to be counted and put to use.

Some examples – Big Data in action

What industries are collecting and using this data? One example is the health care and insurance industry. They collect large amounts of data in order to derive predictive models for people, costs, treatments, and propensity for disease. The airline industry has successfully developed very complex real-time ticketing systems.

The automotive industry; receiving datatstreams from cars, navigation systems, fuel consumption, oil quality.
B2C retailers: consumption patterns, stock, ordering, returns, sales – and how all of this ties in to online advertising campaigns, conversion, and efforts; ad delivery.

Outsourcing data management – IaaS

In the past, companies kept this data themselves, everything needed was to be found in-house and many work stations were not connected to internet. Now its a requirement to have an internet connection as a resource while developing. Despite this, many companies are hesitant to outsource data management. Data management means managing and storing the data, and more importantly – being able to query it. Traditionally, data has been stored in databases and only later, if ever, consulted.

What’s happened recently though, with the onslaught of data, is that a company has to become specialized in data management just to be able to cope. That translates into infrastructure (hence the new IaaS; Infrastructure-as-a-Service). The alternative is for a company to purchase their own engineers and infrasturuture.

next: Part 2 Ownership, Terminology, & What questions to ask

Identify and track your visitors

Web analytics dashboard – customer engagement

Web analytics dashboard – customer engagement

Start your free, no-risk, 4 week trial!

Opentracker web analytics dashboard navigation : customer engagement

Enterprise Dashboard

We are very pleased to release a Dashboard, currently available for Enterprise clients.
For ten years we have been perfecting the art of displaying a lot of actionable information in a small intuitive space.

With the release of our dashboard, which reports on visitor/ user/ customer/ client engagement and metrics, we are able to show you everything important about your visitor behavior at-a-glance.

The dashboard consists of seven elements, a Trend Summary table and 6 traffic metric tables.

Opentracker web analytics dashboard navigation : customer engagement

Example customer engagement metrics to display:

  • single event sessions
  • page views per session
  • average time on site
  • number of sessions
  • number of page views
  • number of returning users

Segmentation –
The future of custom visitor reporting has arrived.

All the data on the dashboard can be segmented by browser, country and platform by default and also be downloaded as raw data.
Opentracker dashboard segmentation : customer engagement

Why we need Big Data in the field of Psychological Research

Start your free, no-risk, 4 week trial!

Why We Need Psychological Research based on Big Data

Summary

In this article, we will talk about why Psychological Researchers should rely on Big Data more often than traditional Research methods. Additionally, we will also look at:

  1. The benefits of using Big Data for Psychological Research
  2. How helpful is Big Data in terms of Predictive analysis

Introduction

Big Data has proven helpful in psychological analysis, especially in analysing, detecting and comparing behavioural patterns in social media, to achieve goals that include targeted marketing and political campaigns; Although, the use of this data in Psychological Research is not as common; Yes, Big Data is used in Psychological Research, but given the reliability of such data, it should be rather emphasized.

Benefits of Using Big Data

big data applicationsOne of the greatest benefits of using Big Data in Psychological Research is the fact that Big Data is pure “Data”, therefore it lacks the human error that sometimes accompanies the targeted sample’s facts that are mixed with an opinion or inaccurate facts that are mildly influenced by the environment where the research is conducted. For instance, in a scientific paper published on 2015 in the PNAS (Proceedings of the National Academy of Sciences of the United States of America) by Dr Youyou Wu, what an individual of a certain age group likes or posts on Facebook have proven as far more reliable in terms of predicting personality patterns than personal analysis of the individual’s own personality traits.

Examples of How Big Data Helps with Research

big data applications

Case 1:

Another incident was debunking the theory that there is a correlation between how good someone looks and their attitude; i.e., previous surveys which interviewed people around the so-called attractive individuals, the overall alignment of the study suggested that a majority attractive people do possess a certain degree of narcissism, but there is the unreliability arising from certain human emotions (jealousy, envy; to name a few). The study was later repeated and duplicated in a different environment, the supposedly fertile land for narcissistic behaviour: Social Media.

The Study:

This recent study used machine learning algorithms and web-scraping, to compare thousands of Twitter users with identifiable profile pictures of people that match traditional beauty standards (omitting those with celebrity pictures etc.) while simultaneously keeping track of the tweets of those supposedly attractive people. According to the researcher conducting this study, Dr L. Lui; there is no correlation between physical attractiveness and possessing a grandiose personality.

Case 2:

Another case is the survey that interviewed men from several states in the USA, asking them whether they felt any sort of attraction for other men, and it was clear that there was a drastic difference between regions that were more tolerant towards gay people than regions that were not, I.e. LGBT+ friendly states like California and Rhode Island had a significantly higher population of gay people than relatively less intolerant states like Texas and Mississippi, and once this information was out, the public went haywire, suggesting two theories, its either that gay men tend to move to places of more tolerance, or that people in less tolerant states are less likely to respond truthfully and freely in surveys regarding their sexuality.

The Study:

Due to big data, the two theories could be put to test, Stephens-Davidowitz (Data Analyst at Google) used data from Facebook to investigate were men who self-identified as gay were born and where they moved. There was some tendency towards movement from less tolerant to more tolerant places.

But, that movement alone could not explain the large regional differences seen in surveys; the next step was tracking search engines of pornography sites users, specifically males seeking gay-male porn, which suggested that roughly 5% of pornography searches in America; regardless of the region, were searching for gay-male porn. The conclusion was that 5% of men in America are attracted to other men, regardless of the states they are from.

Big Data, Predictive Analysis and Psychological Behaviour Patternsbig data applications

Big Data can be used in predicting language patterns of a certain age group, which can be useful for several reasons; one of which is that if education targeted to a certain age group would be more appealing if it closely resembles the language that they speak; another reason is to make it manageable for linguists to track the evolution of language and predict decaying languages that should rather be rejuvenated as a cultural treasure.

Big data was also able to help Data Analysts predict recent drone attacks in the UK which, predictions were not taken seriously until the Gatwick Airport Drone incident, this promoted the idea of using Big Data to predict human behaviour leading to vandalism, and possibly terrorism.

Conclusion

Big Data is surely reliable in terms of Psychological Research, specifically more than the traditional flawed methods, and several types of research suggest that Big Data is actually more cost-effective than traditional Research Techniques; better, Big Data is capable of the mass investigation of human behaviour over social media, this can help prevent future tragedies, and aid in the development of a more effective educational system.

Here’s How Companies Use Data Science To Launch Product Campaigns

Start your free, no-risk, 4 week trial!

Here’s How Companies Use Data Science To Launch Product Campaigns

Summary

In this article, we’re going to look at data science and its applications in the marketing industry- specifically in developing and launching campaigns. Additionally, we will also learn about:

  1. How data is used to select the theme or topic for a campaign, and
  2. How companies use big data to study trends that will appeal to their target audiences.

Introduction

data science applicationsIf you have been wondering about how data science can be used to manipulate audiences into buying merchandise, then you’re not alone. Thousands of people ask this question every day and yet, there’s nothing that we really do about it. In fact, in order to make it big and run a successful business, it almost seems as though luck has a big role in deciding whether you will succeed or not. While, traditionally that might have been the case; now you don’t have to depend on luck to have a successful business- whether it is an e-commerce store, or a small-scale, home business. All you need to do is promote your product in the correct way. That’s how you will attract the attention of everyone around you in your area, town, city, and even country.

How They Do It

Understanding how to promote products correctly is very important if you want people to buy your products. Just look at all the ‘big’ businesses. Companies like Pepsi, McDonald’s and Adidas spend millions, if not billions of dollars each year promoting, advertising and launching massive campaigns. And they catch our attention because that’s what you need to do to get people to buy your products. You need them to remember your product, catch their attention long enough for them to make the purchase.

That’s really all it is.
Making sure that you remember the product long enough to give in to the trend and buy it.
You will see this theme run across every company- regardless of which sector or how big it is. So, naturally, there’s a lot of competition. And how do you stay ahead of the curb?
You use Big Data to analyze, predict and perfect your new campaign idea.

Choosing Campaign Themes

data science applicationsThe marketing industry has actually been using data science longer than a lot of industries. This is probably due to the fact that promoting campaigns does relay a lot on what sort of products customers would like. After all, you need to make sure that the customer chooses your product at the expense of some else’s. That’s just how it works. But once you’ve got your products made, ready for the world to see them, you need to promote them. In a way that catches everyone’s attention.
Large corporations have the advantage of having entire marketing and research departments dedicated to market research. This used to be more intensive back in the day when surveys from customers were used to decide the theme or tone of upcoming campaigns. Now, while a lot of companies still listen to their customers’ feedback, with the help of Big Data, they’re able to study a lot more.


data science applicationsHow Trends Are Studied

Thanks to the rise in internet usage and social media, it’s become fairly easy to see how different groups of people react to trends. This is why you will often find many brands jumping in on popular trends. They know that people will be keeping track of certain trending topics and they plan to reap profits from it as much as possible. Consumer behavior is fairly simple to track down these days thanks to the voices and feedback of audiences heard via social media. The next step for a company launching a new campaign is to look at the available data and analyze it. With the help of data science, it is now possible to not only process massive amounts of data quickly but to also analyze and ‘predict’ what is likely to happen if a certain campaigning approach is taken. Data science helps companies to analyze rising and falling trends, This way they are able to predict things like consumer behavior, sales and thus are able to price their products according to the state of the current market. This way they are able to form their marketing strategies and the tone of their campaign.

data science applicationsCompanies with bigger budgets will also use data science to predict the right time to launch their campaigns. Again, this is done by processing information and predicting the ‘peaking point’ of a trend. This is the best time to launch a campaign- and it’s all done through market analysis. Of course, this depends on the company’s intentions as well: do they plan on targeting their loyal demographics, or do they want to appeal to a larger audience? Big Data provides them with the most economically beneficial options and then, depending on its profit margins, a company will launch its marketing campaign.

Conclusion

Big Data is a key player when analyzing market trends, and a lot of companies understand this. After all, no one wants to make a loss and everyone wants to make a lot of profit. So, it’s really no surprise that companies have turned to data science to help them understand the massive volume of data available to them. Humans are prone to bias and a single mistake in marketing can cause a significant blow to a company’s reputation as well as its profits. By using data science, they have facts and figures to back their marketing strategies and getting you- the consumer- to pay attention and buy their products.

Analytics – Start using an advanced analytics platform


WEBSITE TRACKING & ANALYTICS

The Art of Data-Driven Decision-Making
(or Who’s doing what?)


Learn more

Image depicting all the advanced features of Opentracker's event based tracking.

RAZOR FOCUS

Get a highly focused dashboards with easy-to-understand visuals – designed for IP tracking & identification.

EASY SET-UP

Use Google tag manager, WordPress plugin or JS to set things up and start generating reports. Get Smart – Get Started. 5 mins set-up.

CUSTOMER-CENTRIC

Reports creation should be fun; schedule reports that are important for your business. World-class support has your back.

Segmentation

Opentracker is a business intelligence & analytics tool which tracks all digital events and engagement important to your business – including clicks, logins, downloads & forms.

We’ve been setting standards for 15 years – find out why.


Try us for free

Image shows curated analytics on Opentracker's event based analytics platform.

Enrich Profiles with Event-Based Data

Opentracker helps build profiles to increase conversions, segment current customers, and understand how your software is performing. Utilizes Opentracker’s cross domain tracking technology to build profiles across all online assets in real-time.

Image shows how Opentracker's advanced enriched profiles render on a laptop and iphone.

Integrate Event-Based Analytics

Integration: our API provides stats that focus on your business’ value proposition.


Try us for free

Real Time Visitor Tracking

Real-Time allows you to monitor activity as it happens on your site or app. Reports are updated continuously and each hit, click, swipe, login or download is reported seconds after it occurs. Follow goal conversions and sales cycle activity as they happen. We pioneered real-time visitor clickstream reporting more than 15 years ago and still lead the pack.

Fall in love with our FEATURES

Real-time Reporting allows you to monitor your visitor's activity

IP tracking in Real-time

Real-Time allows you to monitor activity as it happens on your site or app. From high volume – shifting traffic across media sites to web-shops and commerce: we range from Trend reporting to granular individual visitor tracking. Down to individual IP address collection -for company and location identity.

Search all visitor data, us customer intelligence to find out things about your customer's

Customer intelligence

Customer intelligence is about finding out things like your customer’s competitive experiences and personal preferences — we design to personalize your customer’s experience.

Hand holding iPad depicting easy to use interface.

Easy & intuitive user interface

Perfect balance takes time and skills, we focus on how an analytics application should ‘work’ for marketing agencies, and design for the goals you’re trying to achieve. Right-brain, left-brain – information is beautiful when done right.


Try us for free

Testmonials

We love Opentracker. It is simple and easy to use compared to Google Analytics. We have been working with Opentracker for several years now and will continue to do so.

BRYAN COSTNER

Digital Marketing, iBusMedia

With Opentracker, we are getting enriched customer profiles from online behavior; we filter out interesting accounts, which is just what we were looking for.

BRITANNY K

Lead Developer, fxtime.com

Where is the data – with multiple sources – its chaos. With Opentracker we have simplified the whole process of collecting and downloading the relevant data.

Jady Korzan

Business Dev, Homevisit.com

Target audience

90%
Brand Marketing
87%
Sales & Marketing
76%
SEO Services
40%
Software Dev

Plans and pricing

Small business


49
/ Per month

  • Free trial
  • 1 login
  • Email support
  • 500k events
  • 1 site
  • Limited api


Learn more

Corporate


299
/ Per month

  • Free trial
  • 5 logins
  • Call support
  • 1M events
  • 1+ sites
  • Unlimited api


Learn more…

*******
Popular

Enterprise


4995
/ Per month

  • Free trial
  • Unlimited logins
  • Account manage
  • 1M+ events
  • Unlimited sites
  • Audited api


Learn more