Capture Perfect Customer Profiles With Easy Tool

,

A Modern Customer Profile Template For Smart Businesses

Please try our social profile login by visiting here

Marketers and businesses who use customer profile templates are smart. They know customer profiling helps them target their ideal customers accurately.

A customer profile template is a document that helps you detail critical information about your target customers. You use this information to run marketing campaigns and reach your target audience.

Frankly, you can’t keep all the helpful info about target customers in your head.

From their name, interests, down to even their religion — whatever you can think about your customer, include it in the profile.

Why? The more specific your customer profile, the better your marketing campaigns can reach your target audience.

Here’s a customer profile template you can use for your business:

customer profile

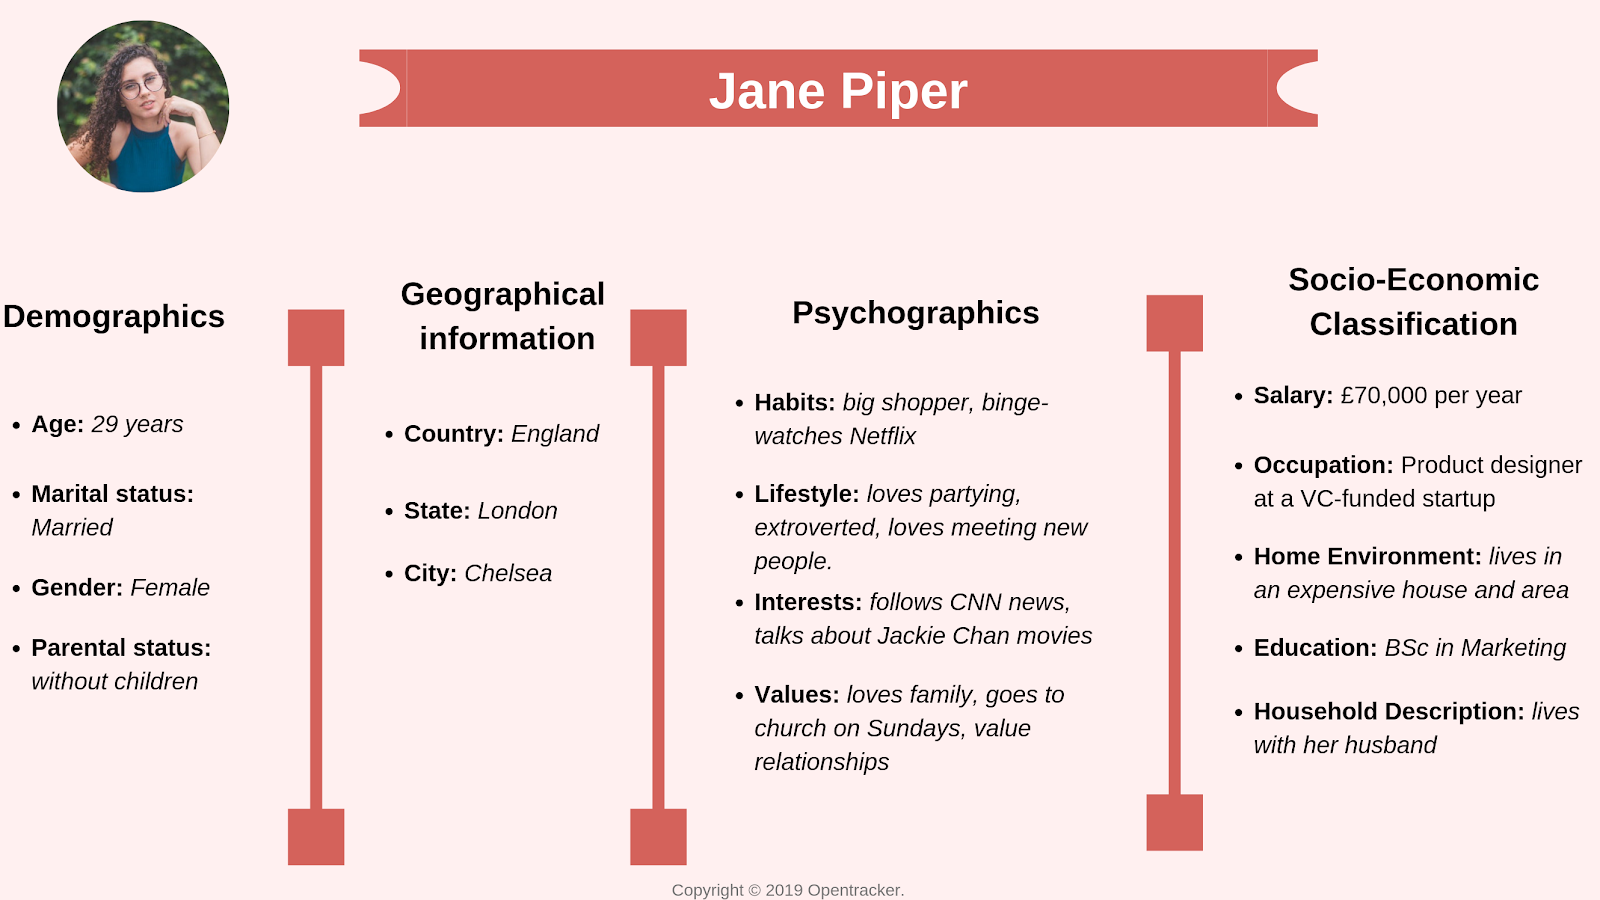
Click on this Customer Profile Template to download it, so you can fill in each column while you read on.

Now, let’s break down all the elements in the customer profile template one by one:

Four critical bits of information to build your customer profile

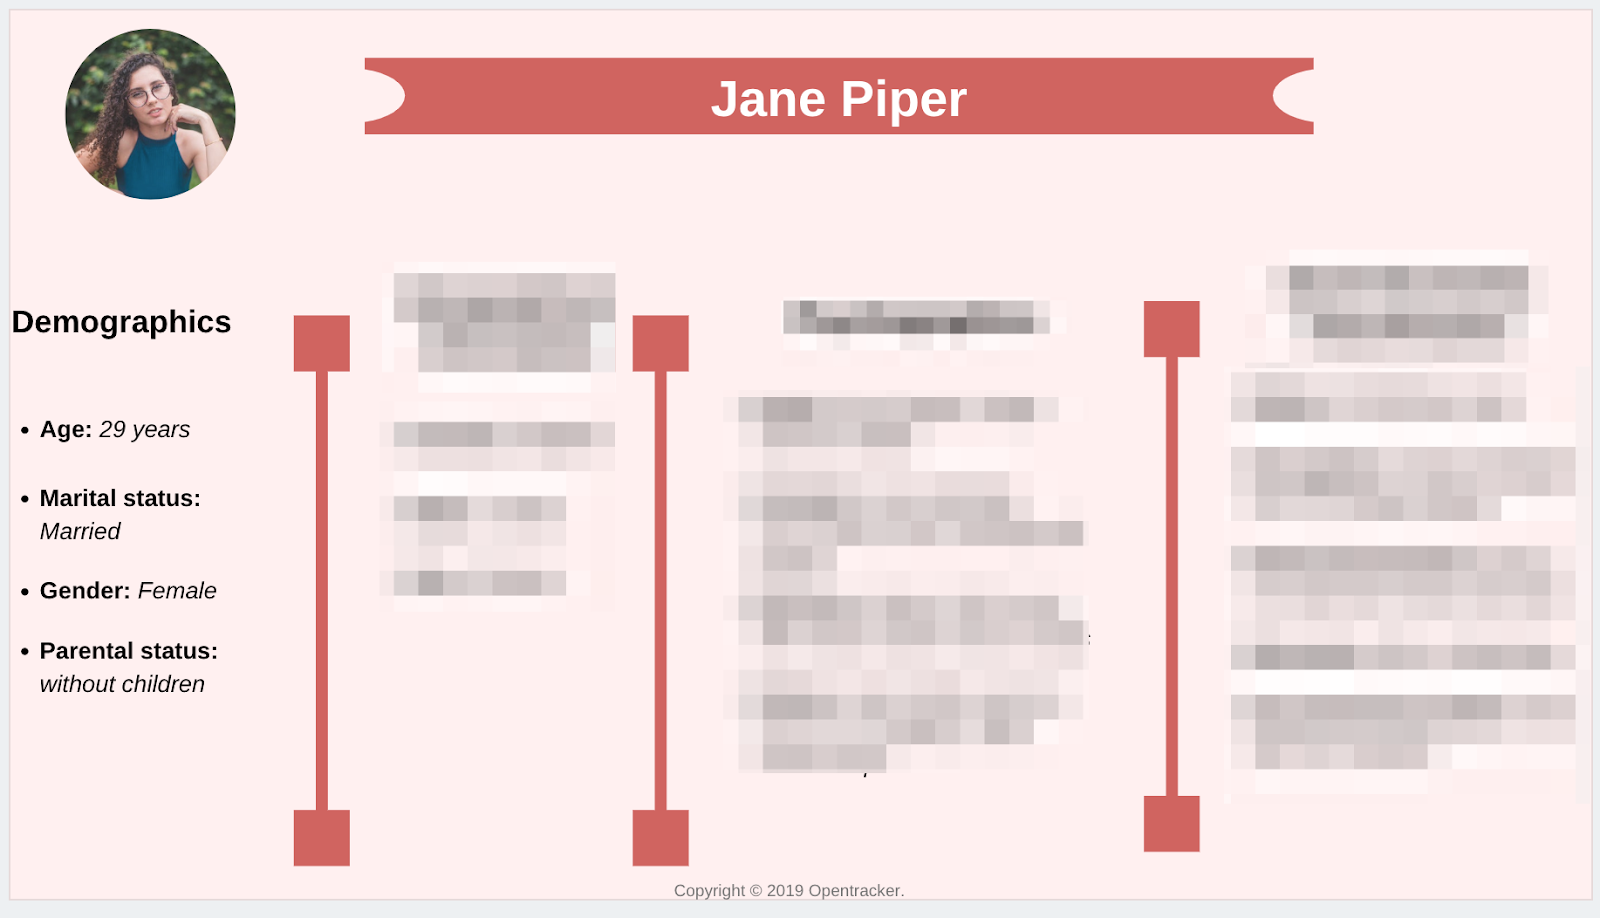
1. Customer demographic information.

This is market segmentation according to characteristics like age, gender, ethnicity, race, religion and education.

customer profile

This part of customer profiling helps you to anticipate customer behaviour.

The more you understand key demographics data about your customers, the better you get at determining their behaviour and designing products, services, or content that they’d find useful.

For example, an alcohol company marketing expensive drinks should only market their products to age groups above the legal drinking age who have the financial capacity to afford the products being marketed.

If your customers are within the 24-30 age range or are married with children, apprise yourself of the interests of people in that demographic, and use that information to create campaigns and products they truly value.

This brings us to the next piece of information you should consider when creating your customer profile.

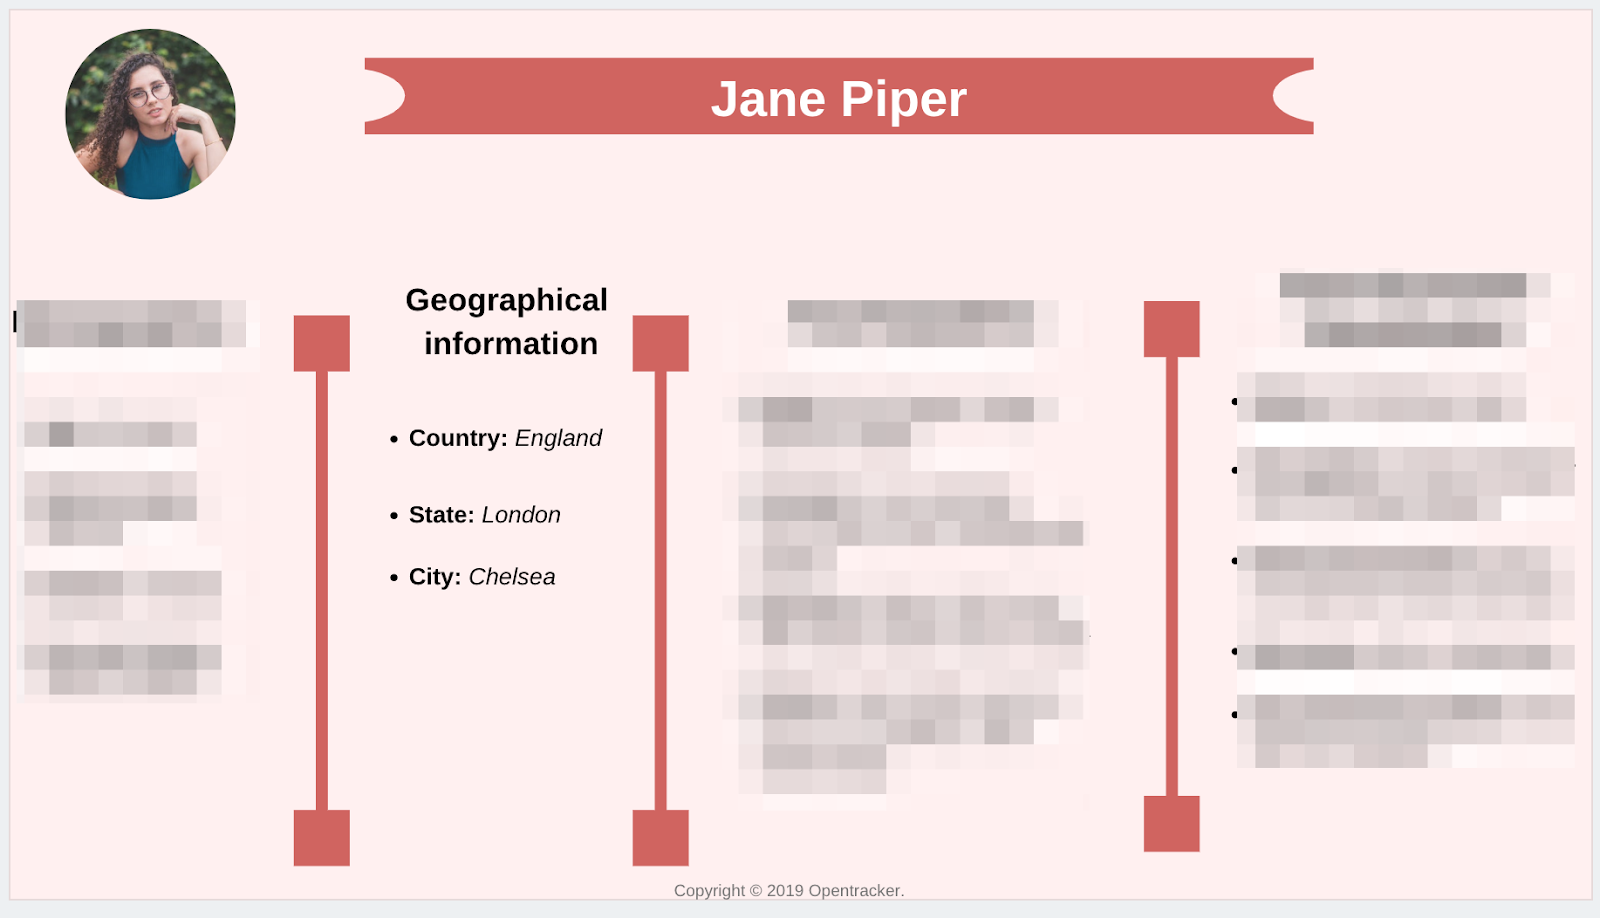
2. Customer geographical Information

Your customers’ geographical information helps to segment target buyers by location so you can better serve them in a specific area.


customer profile


For example, if 70% of your customers come from London, you have no business running marketing campaigns that target people too far from that region.

But geographical information in customer profiling is based on (but not exclusive to) three major factors:

  • Geographical units:

Based on specific geographical units such as countries, cities, etc.

  • Climate:

This is segmentation that involves an expanse of land with the same environmental factors (Sub-Saharan, Pacific Coast, the Caribbean, etc.)

  • Cultural preferences:

Concerning a society’s ideas, customs, tastes, and social behaviours.

You need to mark these geographical differences in your customer profile — because people in different locations are bound to exhibit different traits and have a variety of ideas, culture, needs and wants.

So your customers’ geographical location plays an integral role in customer profiling.

More importantly, geographically segmenting your audience strengthens your marketing campaigns.

Chances are high you’ll have to create ads at some point, and advertising platforms (Facebook, Twitter, LinkedIn, etc.) will require you to provide them with your audience’s location(s) so they can better serve your campaigns to people who will be interested in them.

The more accurate the information you give them, the better they can serve your ads in locations where your customers are.

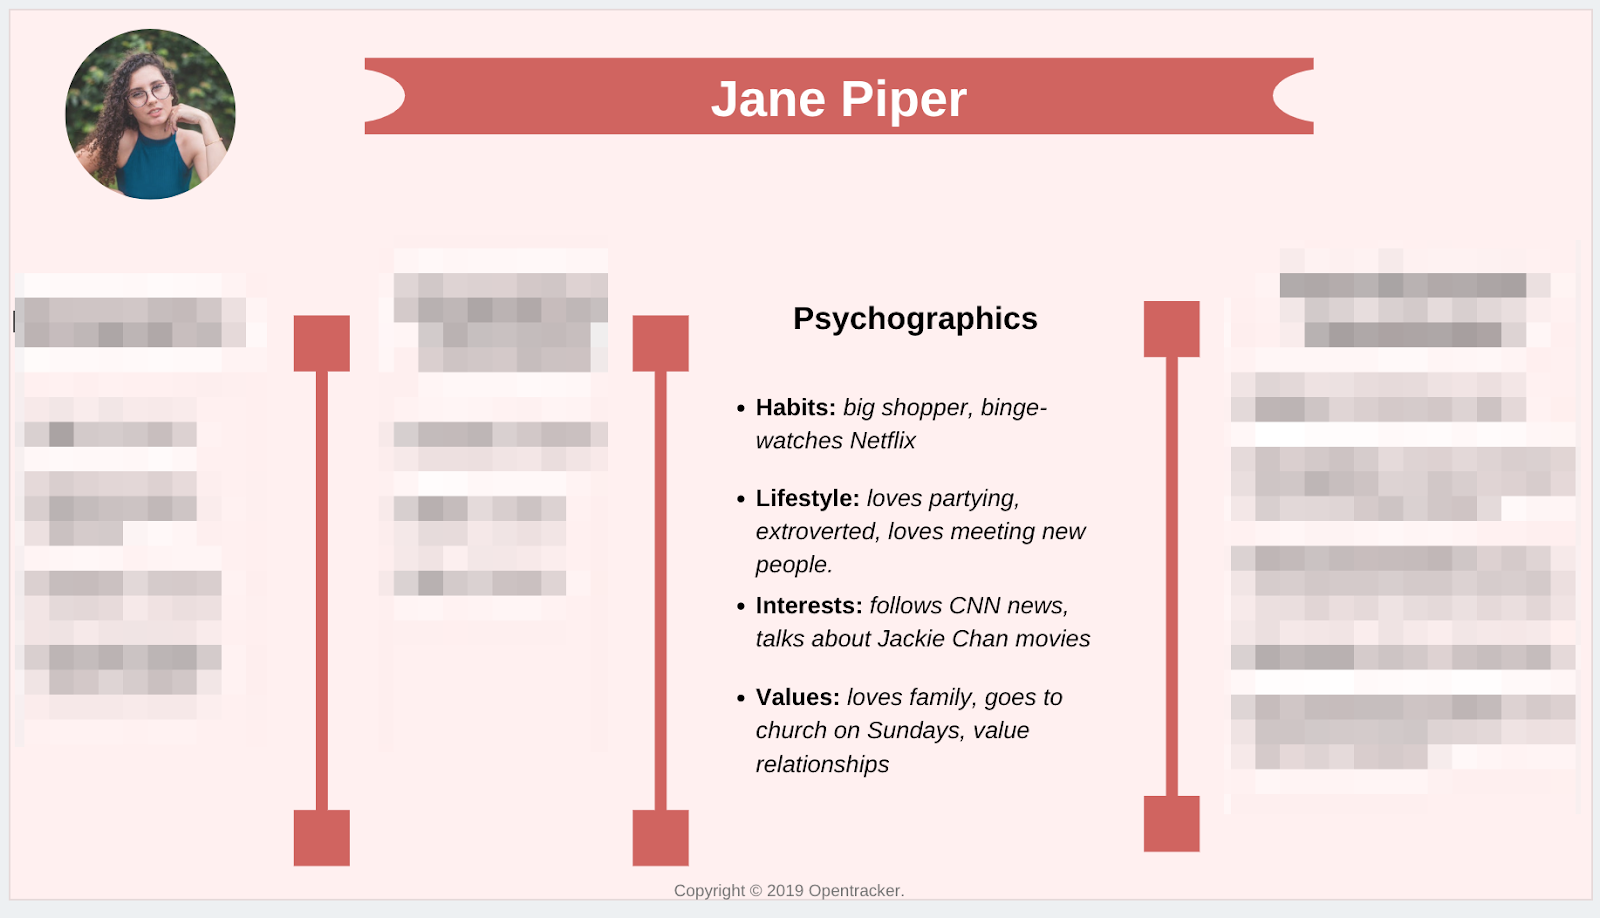
3. Customer psychographic information

Psychographic information deals with people’s hobbies, interests, and all the things they like or don’t like to do.

customer profile

Psychographics are usually confused with demographics but they’re two different creatures with their own nuances.

Demographics cover things like:

  • Age: 18-24; 25-30
  • Marital status: married or single
  • Gender: male or female
  • Parental status: with or without children

While psychology covers things like:

  • Habits: shopping behaviour, time spent on social, etc.
  • Lifestyle: loves partying, introverted, etc.
  • Interest: follows X influencers, TV stations, books, politics, etc.
  • Values: family, religion, etc.

Difference between demographics and psychographics

CB Insights designed an infographic that demarcates the difference between demographics and psychographics:

customer profile

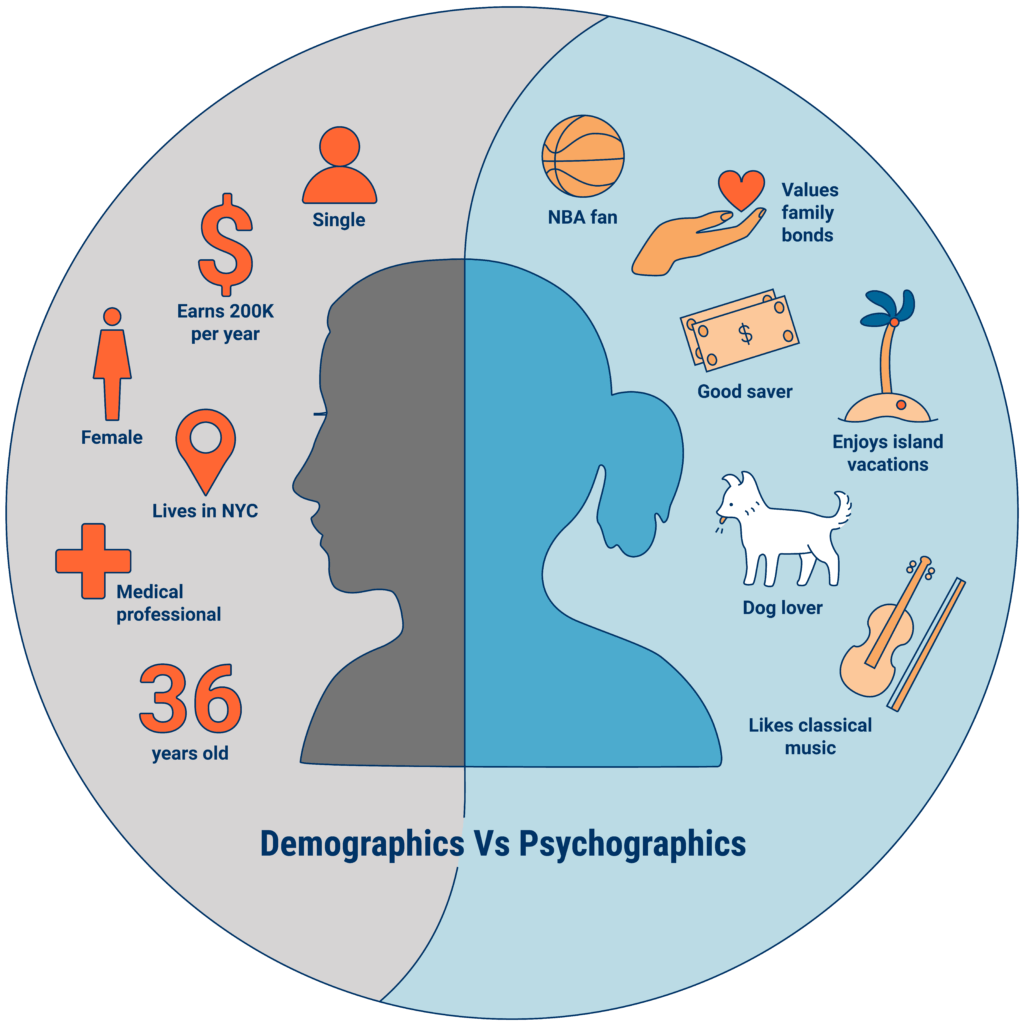
In essence, demographics speak to who people are naturally, while psychographics speaks to how people behave, their personality and their emotional triggers.

So the psychographic section of your customer profile helps you identify your customers based on their interests, values, lifestyles and personality traits. And this will enable you to better develop and market products that match your customer interests, hobbies, and values.

Put another way, customer psychographics put more emphasis on your customers’ psychological factors, while focusing on only behavioural qualities as opposed to raw data as you acquire demographics data in your customer profile.

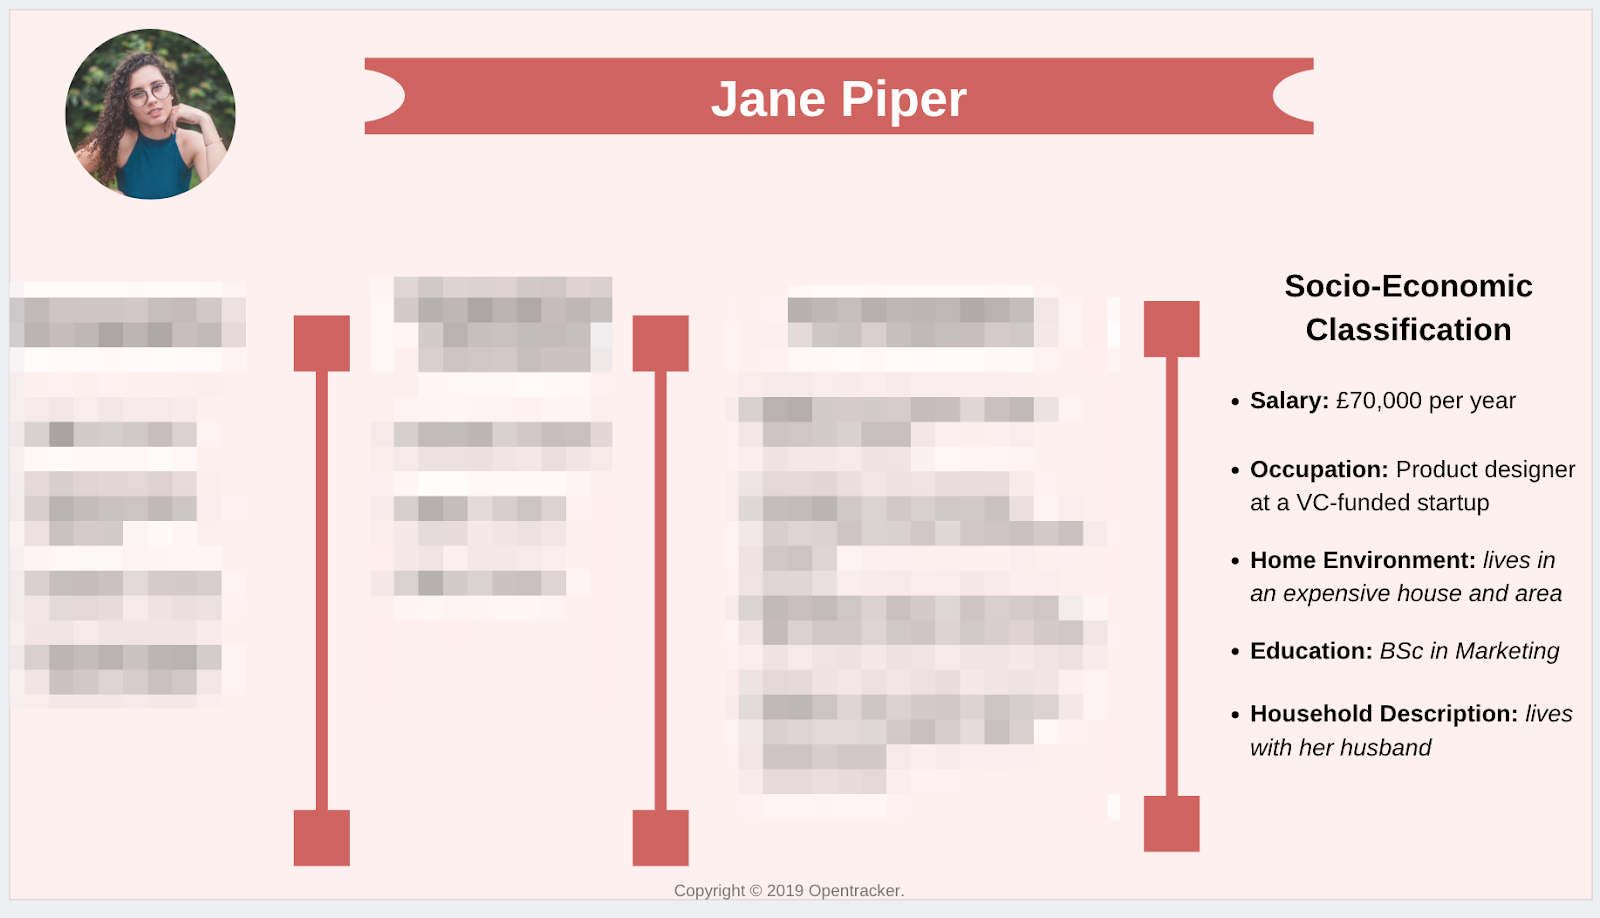
4. Socio-economic customer information

This is a type of demographic classification that examines the aspects of income, occupation and household description.

customer profile

You should consider certain fundamental variables when creating the socio-economic segment of your customer profile.

These socio-economic segment elements include:

  • Income: wages, salaries and any other source of earning flow. When creating your customer profile, consider your target customer’s average income. Know if your potential customer has the expendable income for your product or service. Know whether your product is indispensable to your customer.
  • Education Level: What level of education does your ideal customer have? Does it suggest anything about their relationship with your product?
  • Occupation: Are your customers employees or business owners? Does the customer’s job have anything to do with your product? If yes, does it facilitate their use/need of it or not?
  • Home Environment: Where does your primary target audience live? What are the key characteristics of their area, city or state? Does their home environment suggest they might be in a particular economic class? What notable influences does the home environment have on the customer?
  • Household Description: Consider the size and description of your customer’s household. Are your customers, on average, married with kids? Are they single, living with a partner or engaged?

That’s not all. You should further divide the socioeconomic segment of your customer into socio-economic classes (SEC) — which is a social classification that’s based on occupation.

Your chances of meeting the needs of your ideal customer and selling products or services they can afford become significantly higher when you understand what level of the socioeconomic class they occupy.

One of the most popular formats used to divide socioeconomic classes is the social grading system created by PAMCo. This system, according to PAMco, has been the research industry’s source of social grade data. The system provides a statistical socioeconomic diversification of households in six main classes.

The six main classes are:

  • A – Upper Class: Higher managerial, administrative and professional, such as executive directors, doctors, lawyers, and all high-end employees.
  • B – Middle Class: Intermediate managerial, administrative or professional position.
  • C1 – Lower Middle Class: Supervisory, clerical and junior managerial, administrative and professional.
  • C2 – Skilled Working Class Skilled Manual workers, such as construction workers, and so on.
  • D – Lower Working Class: Semi and unskilled Manual workers, such as mechanical trainees, or shop workers.
  • E – the Lowest Level Of Income Earners: State pensioners, casual and lowest grade workers, students and unemployed with state benefits.

How to get accurate customer profile data

You could guess all the customer information you need or you can view real analytics of the people who have been visiting your site. The latter is clearly the better option.

And this is where Opentracker comes in. Opentracker is an analytics tool that lets you track your website visitors and collects accurate data about them.

customer profile

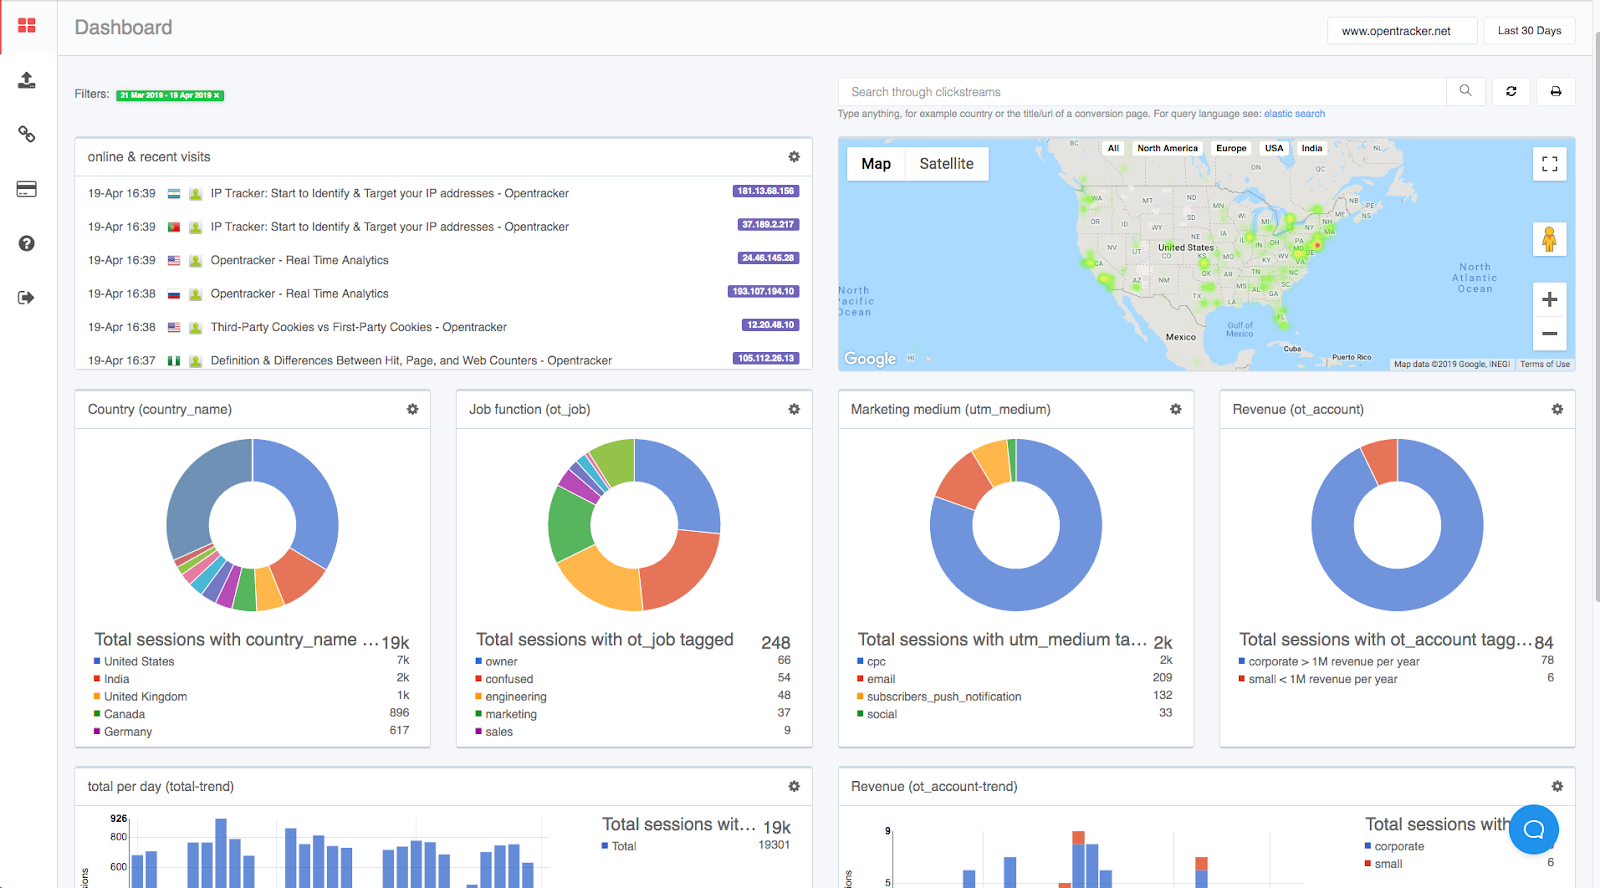
You get all the customer profile information you need, including:

  • Customer socioeconomic information: Your visitors’ average income, the company they work for, their job roles, etc.
  • Psychographic: See how your customers respond to your campaigns. Do they flinch at products or services within a particular price range? Do they get sceptical and start asking questions? Or do they just buy it once they’re convinced it’s a good deal for them? You can find these answers and more with Opentracker.
  • Geographical information: Where (locations) your traffic and highest converting traffic comes from.
  • Custom data: You can search for data that’s specific to your business: With Opentracker we build data-driven customer profile’sSchedule a call to find out how.

Marketing Campaigns: Creating Highly Effective Promotions

,

Facebook Ads Vs Google Ads Vs Instagram Ads Vs Linkedin Ads: Which will get you better ROI

It’s no news that Advertisement has a huge impact on sales. Digital Advertising has made it a lot faster, easier and cheaper to advertise your products.


With the number of internet users being on a steady rise at 11 users per second daily, online advertisement is now one of the biggest ways to promote your products and table your offers. It should definitely be part of your content promotion plan.

The bottleneck with Digital Advertisement is picking the right platform to use, one that would give you the best returns.

It would be refreshing to know the platform with the best ROI for your business. 

Many Digital Marketing Experts have pounded on this, and after interviewing four digital marketing experts the answer still remains the same – it depends,  not the answer you’re looking for but read on.

Picking the best platform for your business depends on a number of factors, like the kind of business, the goal of the business at that given time and your budget. This is because these applications were launched at different times, for different purposes and dissimilar consumer profiles.

In this article, we’ll make the task of choosing or not choosing a platform less daunting by giving you an actionable strategy to use when choosing an advertising channel and also by comparing Facebook, Google, Instagram, and Linkedin Advertising Platforms; based on their features, cons, pros, most expensive, the platform with the most views and benefits with respect to years of research and experience of Digital Marketing Gurus.

Comparing Facebook, Google, LinkedIn and Instagram Ads.

The Ad Formats

Google

With Google Ads, you can target ads based on what users are searching for on Google, your ad can be in the form of text, image, video or call. You can also narrow who sees your ad by adding age, gender, demographics and country. 

  • Text: You can advertise your product or service by targeting search keywords and phrases. For instance; if you’re a legal lawyer in California looking to advertise your service on google. You target keywords such as “legal lawyers in California” or “I need a legal lawyer in California”. So when someone searches for the picked term your ad shows on the result page like so; 

With google text ads choosing the right search term to target for is prime. You want a phrase with the right volume and audience for your business.


  • Image: You can use static or interactive graphics or animated ads(.gif and flash format) to place your ads on businesses that partner with google on their website or app. 
  • Video: Google places your video ad on YouTube or across google’s video partner sites depending on your goal, settings, and type of content you want to promote.


  • Call:  Google drives phone calls to your business with ads that include your phone number. People can click on these ads and then call your business directly.                    
  • Product cart Ads: Your Ad will be displayed to people shopping online for that product or related products.                                                   

Facebook

With Facebook , You can target Facebook ads based on their age, gender, languages, activities they perform on the app, or lookalike audience (ie profiles that are identical to your existing customer profile.).With Facebook ads, you can showcase your ads using an image, video, carousel, slideshow, instant experience, and collection.

  • Photo: Facebook allows you to show engaging photos on your targeted user’s feed, stories or even their Facebook messaging platform.


  • Video: You can showcase a video ad to your target profile on their feed or story. 
  • Playables: Playable ads offer people an interactive preview on Facebook before they download an app.

  • Instant Experiences: formerly known as Canvas, allow you to create a full-screen, fast-loading destination designed for mobile and add them to almost any ad format.

  • Slideshow: Slideshow ads are video-like ads made of motion, sound, and text.
  • Carousel: Carousel ads let you showcase up to ten images or videos in a single ad, each with its own link.

LinkedIn

You can target LinkedIn ads based on location, company name, company industry, size, the school they went to, years of experience of a particular skill, gender, target groups, and age.

  • Sponsored Content: This Ad type appears alongside content LinkedIn members curate for themselves. You can think of them as promoted posts, as they are essentially amplified versions of the links, media, or messaging you would normally share through your Company Page.
  • Sponsored InMail: You can use this feature for sending personalized messages to highly targeted recipients. Sponsored InMail only delivers to active LinkedIn members, there is no need to worry about messages bouncing or landing in abandoned inboxes. You can tailor your content directly to the audience, and a responsive design ensures that your CTA button is always visible on any device.
  • Text Ads: Linkedln displays this ad on the side rail or inline. It is only shown to desktop LinkedIn users.

Instagram

Instagram ads are identical to Facebook ads. You are able to target profiles based on demographics, gender, interest, behavior, lookalike audience, custom audience(people you know by inputting their email or phone number), automated targeting(they create a profile based on people they think would be interested in your product by their activities on the app). Their Ad format is the same as Facebook. Using Images and Videos on feed or story, Carousel, etc except for instant messaging instead they offer “ explore ads”.

  • Explore Ad: Showing ad Videos or images to people when they are on their Instagram explore page.

Average Cost.

The Average Cost depends on how much you are willing to spend. You have the ability to set a limit on the amount you want to use and see the result it will get you then decide if you need to invest more money or not.

Google: The average cost-per-click (CPC) on Google Ads is $1 to $2 for the Google Search Network and less than $1 for the Google Display Network(Advertising with google partners).

Facebook: If you’re measuring cost per click (CPC) Facebook advertising costs on average about $0.27 per click. If you’re measuring cost per thousand impressions (CPM), Facebook advertising costs about $7.19 CPM.

LinkedIn: On average, businesses pay $5.26 per click and $6.59 per 1000 impressions, as well as $0.80 per send for Sponsored InMail campaigns.

Instagram: On average, Instagram advertising costs between $0.20 to $6.70. For CPC or cost-per-click, advertisers pay $0.20 to $2 per click. For CPM or cost-per-impressions, advertisers pay $6.70 per 1000 impressions.

Audience Volume and Views.

Knowing the user volume and average views of an advertising platform is not so important. This is because their volume and views do not determine their user engagement rate with your ad.

I mean you won’t want to advertise on a platform with 0 views but even if a platform has 20,000 views and another has 200,000, your decision should still be based on if these views include your target audience because if not, you are advertising to people who are not interested in your product or service. In other words, you are wasting your time. You can advertise on a platform with 200,000 views and your conversion rate will be 0.1% and on a platform with 20,000, your conversion can be 2% depending on your customer profile.

Google: Google now processes over 40,000 search queries every second on average which translates to over 3.5 billion searches per day and 1.2 trillion searches per year worldwide.

Facebook: Facebook has a total of 2.5 billion monthly active users and 500 million Story viewers.

LinkedIn: LinkedIn has 627 million monthly users and 40% of monthly active users use LinkedIn daily.

Instagram: Instagram has 1billion monthly active users, 500 million+ story views daily and 4.2 billion photo likes per day.

Average Conversion Rate.

The conversion rate is the number of conversions divided by the total number of visitors. For example, if a site receives 200 visitors in a month and has 50 sales, the conversion rate would be 50 divided by 200, or 25%.

Facebook: Facebook has a conversion rate of around 9.21%, which is very high with respect to the number of users they have monthly.

Google: Google’s average conversion rate hovers around 3.48% for search ads, and .72% on the display network. Display ads, therefore, are really best suited for strong campaigns.

Linkedln: Linkedln has a conversion rate of 6.1% for sponsored posts, 3.48% for text ad and 2.5% for Inmail ads.

Instagram: Instagram has a conversion rate of 1.08%.

Average Click-through Rate.

Click-through rate is the rate at which your ads are clicked. This number is the percentage of people who view your ad (impressions) and then actually go on to click the ad (clicks). The formula for CTR looks like this:

(Total Clicks on Ad) / (Total Impressions) = Click-Through Rate

Google: Currently, the average click-through rate for search ads on Google is 1.91%. Whereas the average click-through rate for Google’s display network(Google partner websites, videos, and apps) is 0.35%.

Facebook: The average click-through rate for Facebook is 0.9%

LinkedIn: Presently, the average click-through rate for search ads on LinkedIn is 4.1% for text ads and 0.39% for sponsored content. LinkedIn is improving rapidly, hence the ctr is subject to constant change.

Instagram: The current average click-through rate for Instagram ads is 0.52%

Audience Type.

Google: Google’s audience type varies, old, young people all “google it”. Before advertising with google, the one time you ought to do is check the search term with the best ROI for you. This guide can help you.

Facebook: Facebook is actively used by individuals between 29-65 years, mostly college graduates. It’s a good place for B2B advertising, eCommerce and service-based ads.

Linkedln: Linkedin comprises majorly by individuals looking for job opportunities and others offering jobs and rarely for personal use, with their ages between 20- 50 years. It’s best for B2B content, Finance and it wouldn’t be so good for eCommerce.

Instagram: Instagram is used majorly by a younger audience, focused on small scale businesses, eCommerce and lifestyle.

Usability.

Ease of use is subjective and shouldn’t discourage you from using any advertising platform before using it yourself. According to reviews and digital experts; Facebook ads are the easiest to set up followed by Instagram, then google and finally Linkedin. Below are youtube videos on how to easily navigate and set up Ads on these platforms by Gurus in each field. Google Ads, Facebook Ads, Linkedin Ads and Instagram Ads.

Customer Support.

This is important because anything can happen and it’s paramount that you are able to get reliable and fast support when it’s needed.

Google: Google has a customer support number which makes it very fast and you can also fill out their customer support forum to leave a message on their ad forum.

Facebook: You receive help from Facebook by visiting their help center where they have FAQs and also leave a message on their Facebook help community.

Instagram: You are able to reach Instagram by visiting their help center where they have FAQs and also leave a message in their support forum.

Linkedin: You can contact LinkedIn by going to their help center for FAQs and also by leaving an email for them to respond to.

According to the data above, Google has the best customer support then Linkedin followed by Facebook and Instagram.

Retargeting.

Retargeting is a form of online advertising that can help you keep your brand in front of bounced traffic after they leave your website. For most websites, only 2% of web traffic converts on the first visit. Retargeting is a tool designed to help companies reach the 98% of users who don’t convert right away.

All the above-mentioned platforms (Google, Facebook, LinkedIn, and Instagram) have the retargeting function. Giving you the ability to show an ad again to someone that took an action on the ad the previous time.

Here’s a simple strategy you can use to pick an online advertising platform.

  1. Using a Software Program like Opentracker, you are able to track where your existing customers/visitors are coming, you can also see the search keyword, word or phrases that drove them to your site.
  1. Using an eCommerce Teenage Thrift Store as an example;
  1. Know your Audience base: Having a customer profile and picking the right search term is very important here because it’s the base of everything that follows. Most thrifters are between the age of 13- 30 and mostly female.
  2. Have a business goal: Their goal at this point is to get more awareness and conversion.
  3. Check Each Platform for the one with the highest search volumes on multiple keywords for your company.

Instagram


LinkedIn

Google


Facebook


In addition: You also check for the click-through rate and conversion rate for your keyword and your company type on each platform.

  1. Pick one or two at first based on the highest search volume and the goal at that point: Based on the results above as the thrift store digital marketer I will run ads on Instagram because of the search volume and age brackets of Instagram users and I’ll also invest in google to see which one gives a better return. If it were a thrift store I’ll invest in Facebook, Google and/or Instagram and track the results depending on my ad budget.
  1. Get an Expert or self-study the platforms.
  1. Budget Wisely.
  1. Track the results.

Concluding Thoughts:

Deciding to utilize Online Advertising can make or break your business.

All platforms can give you high or no returns depending on how you use it.

Implementing the tips and strategy shown in this article would help you choose wisely.

How Quality Service Affects the Buyer and Customer Journeys

,

How Quality Service Affects the Buyer and Customer Journeys

The importance of quality service cannot be overstated. Quality service affects both the buyer’s journey and the customer’s journey. It is essential to the success of any business.

Establish Trust

The first of these is, of course, the initial contact a potential buyer has with a company. If this contact is positive and the potential buyer can recognize value in your offering, they are much more likely to continue considering your company as an option. Quality service at this stage helps to build trust, which is an essential building block for any business relationship. Showing social proof can help to garner trust and increase confidence in potential buyers, as they can see that others have had positive experiences with your company. Additionally, showing insight into your target audience’s pain points and addressing them with top-tier, personalized customer service can make all the difference.

Cultivate Relationships

The next pivotal moment where outstanding service can make a real impact is during the sale itself. If a potential buyer feels like they are being treated fairly, listened to, and that their business is valued, they are much more likely to make a purchase and become a loyal, lifelong customer. Once again, this comes down to trust; if a buyer feels like they can trust a company to deliver on its promises, they are much more likely to do business with them. 

Build Loyalty

The journey doesn’t end once a buyer has made a purchase, of course. In fact, it’s only just beginning, and is now considered the customer journey. The objective is to turn once-off buyers into repeat customers, and quality service is essential to making this happen. This is about personalizing the customer experience to ensure that it is tailored to their specific goals and preferences. Collecting this data along the way is, therefore, essential.

Maximize Sales

Finally, dealing with repeat customers is potentially the most overlooked opportunity for quality service. Just because a customer has already made a purchase or a series of purchases, it doesn’t mean that they are no longer important. In fact, repeat customers are often some of the most valuable, as they are likely to spend more, more frequently. Following up with repeat customers to thank them for their business and see if there is anything more that you can do for them is a great way to show that you value their loyalty. 

Quality service is not a one-time event; it’s an ongoing journey that should be consistently improved and refined to ensure the best possible outcome for both your customers and your company.

Opentracker allows you to track your customer journey in real-time, creating automated reports that give you detailed insights into every stage of the process, make data-driven decisions on how to improve service and maximize sales. 

3 Ways AI Will Transform Marketing & the Customer Journey in 2023

,

3 Ways AI Will Transform Marketing & the Customer Journey in 2023

In the early days of the digital age, responding to a customer’s comment on social media was enough—but those days are long gone. To remain competitive in today’s online landscape, businesses are changing their approach from offering customer service to being customer-centric.

This means the customer should be the focal point of the entire experience, with each touchpoint tailored to create lasting satisfaction. Positive experiences lead to loyal customers, but implementing a customer-centric approach across all touchpoints can be challenging for businesses that take a manual approach to their customer journey.

Over the past few years, artificial intelligence (AI) has advanced to the point where it now has the power to provide an enhanced and intelligently informed customer experience. Using machine learning (ML) and natural language processing (NLP), AI for customer service can solve issues without human intervention—but it can also do much more. Keep reading to discover how AI will transform the customer journey in 2023 and beyond.

1. Deliver a Personalized Customer Experience

For a truly customer-centric experience, brands need to design each touchpoint of their journey to effectively engage and convert their audience, and AI is making it more seamless than ever.

Targeted Offers

When you combine CRM, behavioral psychology, and AI, you can utilize user data to deliver personalized offers, messaging, content, and rewards that enhance the customer journey and cultivate brand affinity.

24/7 Convenience

Every marketer knows that convenience is the key to customer satisfaction. AI-powered customer service chatbots provide real-time assistance and proactive solutions that keep potential customers engaged and satisfied. 

AI Insights

AI can offer your organization behind-the-scenes support by equipping your service team with access to vital information. For example, if a customer wants to know about payment options and product information, AI can seamlessly pull up these resources so your service agent can focus their attention on the customer.

2. Save Valuable Time and Resources

Creating content that connects with your customer is a vital touchpoint of the customer journey—but producing high-quality content can become prohibitively time-consuming, especially if you’re a start-up or small business. Recent advances in AI-powered content generators empower you to create and rewrite content at lightning speed without needing to hire additional resources. Some of the leading AI content generators in the market today offer features such as blog title suggestions, SEO keyword planning, topic research, image sourcing, and content creation.

3. Enhance Cross-Channel Communication

Before the internet, customers had limited ways to contact a brand. But today, there are countless engagement channels to keep track of which can stand in the way of seamless cross-channel communication within teams. An AI-powered system can keep track of each communication touchpoint in your customer journey (e.g. calls, emails, chat) to provide analytics on each interaction, helping you build a seamless, unified journey that keeps your team on the same page while bolstering customer satisfaction.

Are you ready to harness the latest technology to enhance your customer journey? Get expert guidance from those at the forefront of innovation. Opentracker’s robust platform empowers you to automate the customer journey while providing in-depth analytics that let you continuously refine your customer experience to stay ahead of the latest digital trends.

What Web Metrics Can Do For You

, ,

What (exactly) web metrics can do for you. Fail to plan : plan to fail

Business is based on margins and profits.

In order to generate a specific profit X, there is a minimum amount of sales Y that need to take place.

Business forecast and managing a business rely on calculations. Whether or not costs are covered and sufficient revenue is generated should not be left to chance. Website and customer journey analytics are necessary to determine what is working, what is not working and how to ensure business health. Click to read about driving performance with customer journey.

In a nutshell: business and website managers need to stay on top of actual performance and make ongoing changes

Example

This is where statistics come in. For a web-based business the success of the business depends on a combination of several metrics:

  1. The amount of traffic that comes in
  2. The amount of traffic that converts
  3. The average, or total, value of the conversions
  4. Additional consideration is whether or not the revenue is recurring

The take-home is that these metrics need to be reverse-engineered to ensure that the business stays healthy and grows. Projections can be made based on historical data. Current data is then used to calculate revenue projections. Action can be taken if the numbers are not high enough.

Conversion rates tend to stabilise and do not change again, unless something else change – click to read how this works. In other words, if you receive on average 20-30 visitors per day, this will remain more-or-less constant.

Unless you increase or decrease the budget or change your marketing content you will receive a constant amount of visitors.

In a great many cases, the amount of traffic that converts (conversion rate) is also consistent or stable.

The point is that you can use metrics to:

  1. Reverse engineer (predict) how much revenue will be generated based on current and historical traffic.
  2.  Perhaps more importantly – know when the numbers are too low, when your efforts are not succeeding; and when you need to add or change traffic sources and marketing strategies.
  3. Businesses rely on predictability. Metrics measure what is actually happening and are used to calculate:
    • Predictions
    • Signals that additional actions to generate revenue need to be taken
    • Validation of continued attempts to generate both traffic and ensure that the traffic is converting. Especially as there are multiple sources of traffic, which needs to be measured per channel (see below).

The last point in this train of thought is that there are multiple channels (traffic sources) through which your customers journey:

  • New traffic
  • Existing (returning) traffic
  • Nurturing (newsletters)
  • Direct cold outreach emails
  • Blog posts and articles
  • White papers and downloads,
  • SEO campaigns with different vendors; Google, Facebook, Instagram, Linkedin, etc. 

The take-home is that (conversion) metrics and customer journey analysis tells you which of these channels are working and which data is essential to creating and managing success.

Power of Customer Analytics

, ,

Power of Customer Analytics

Today’s businesses are swimming in data. But, as any swimmer knows, it’s not enough to just be surrounded by water – you have to know how to use it to your advantage. That’s where customer analytics come in. Customer analytics is the process of using data to generate insights that can improve your business, increase revenue, and drive customer retention. 


There are four main types of customer analytics: descriptive, diagnostic, predictive, and prescriptive. In this blog article, we’ll take a closer look at each one, and explore how you can use customer analytics to improve your business.


Descriptive Analytics

Descriptive analytics answer the question “What happened?”


They provide a snapshot of what has already transpired, such as how many customers made a purchase last month, what was the average order value, or how long it took for a customer to make a purchase. Descriptive analytics are important because they provide a foundation for understanding the way your customers behave. This type of data can be used to identify trends and patterns, which can be helpful in forecasting future behavior. To generate insights from descriptive analytics, businesses need to have access to data that is organized and structured in a way that makes it easy to slice and dice. This data can come from a variety of sources, such as customer surveys, website analytics, transaction records, and social media data. However, descriptive analytics cannot tell you why something happened, which is where diagnostic and predictive analytics become valuable.


Diagnostic Analytics

Diagnostic analytics answer the question “Why did it happen?”


They help you identify the root cause of an issue, such as why customers are leaving your site without making a purchase, or why orders are being delayed. Diagnostic analytics use data mining techniques to uncover relationships and identify causal factors. This type of analysis can be used to improve processes, optimize performances, and resolve problems. Diagnostic analytics can be obtained through surveys, customer interviews, focus groups, and other qualitative methods where customers can provide feedback about their experience. Alternatively, services like Opentracker can provide website data that can be used to diagnose problems so you can improve the customer experience and mitigate issues before they cause long-term damage.


Predictive Analytics

Predictive analytics answer the question “What could happen?”


Based off of historical data, predictive analytics uses statistical modeling to generate insights about future trends and behavior. This type of analysis can be used to identify opportunities and risks, make decisions about resource allocation, and develop marketing campaigns. For example, predictive analytics can be used to determine which customers are likely to churn so you can take steps to retain them, or to identify which products are likely to be popular so you can stock more of them. To generate predictive insights, businesses need data that is clean, accurate, and complete. Having a team of experts onboard who are skilled in statistical modeling is also critical for this type of analysis. In-house data scientists can be costly, which is why access to our team of professionals is included in an Opentracker subscription so we can assist you in generating predictive insights and interpreting the results as your business grows.


Prescriptive Analytics

Prescriptive analytics answer the question “What should we do?” 


It’s not enough to know what happened in the past or what could happen in the future. To make data-driven decisions, you need to know what actions you should take to achieve your desired outcome. This is where prescriptive analytics comes in. Prescriptive analytics uses optimization algorithms to identify the best course of action, given a set of constraints and objectives. This type of analysis takes into account a variety of factors, such as costs, risks, and benefits, to help businesses make decisions that are in their best interest. With the right data in your hands, you can start to develop prescriptive analytics solutions that will allow you to automate decision-making and improve your overall efficiency.

No matter what type of business you have, customer analytics can be a powerful tool for driving growth and success. By understanding the different types of customer analytics and how you can use them, you can make better decisions, improve your operations, and move your business forward.


Opentracker offers a suite of tools and services that are designed to be user-friendly and scalable so businesses of all sizes can benefit from data-driven decision-making. We help you automate your customer journey reporting, uncover actionable insights, and make better decisions that drive real results. With direct access to our data analytics team, a dedicated customer success agent, and a dedicated database engineer, you can be sure that you’re getting accurate, actionable data you need to grow your business. 


Book a discovery call today to learn more about how Opentracker can help you turn data into insightful, actionable customer intelligence. 

Improving Customer Experience

, ,

How does deeply understanding your customer’s journey unlock revenue?

You’re in the business of satisfying your customer with a great experience. But how do you know if you’re delivering?
 
customer experience

Businesses are spending more on promotions than ever before, but most struggle to know what actions to take and where to focus their efforts.

When customers don’t buy, do you know why? Can you improve the buying experience? The marketing? Differentiate the product? Without an idea of what your customers are feeling or how they are engaging, it’s hard to make informed decisions.

Privacy laws are making it clear that it is important to collect your own data related to your own customers. Trusting third parties like Facebook or Google to give you these insights is now a significant risk. More and more businesses are choosing first party solutions.

Getting sales is great, but how many sales are you losing because you are not seeing bottlenecks in the customer journey? Knowing what delights and discourages your customers is next to impossible without controlling your own data.

Customers have 5 touchpoints, sometimes spanning days or weeks, before making a purchase and you following up. Are you measuring these touchpoints to increase conversions?

Moving The Needle And Driving Revenue

Not tracking your customer’s journey is like tossing money out the front door.
For any business, tracking the customer journey is essential. As Peter Drucker said “If you don’t measure it, you will not improve it”. All too often, you’re forced to guess how your customers will buy. You don’t know what’s working and what’s not. Consequently, you have no idea what to optimize. You’re wasting money.

You should guide customers through their journey. Provide support when they get stuck. Learn what makes them leave and why you can’t close the deal. Don’t rely on just Google’s or Meta’s report.

Track The Customer Journey. Own Your E-Commerce Dashboard.

Customer Journey by Opentracker makes it easy to control the customer’s journey. We help you get a clear picture of how you can improve what you’re doing – and where you need to make adjustments. The result? You get more sales.

Our platform helps track customer behavior and delivers essential insights. Whether it’s tracking new leads and acquisition or understanding retention and the factors that drive repeat purchases. Customer Journey provides clarity and actionable insights that boosts your ROI.

With Customer Journey, you will get the data insights you need faster, more reliably, and at a fraction of the cost. Our team is dedicated and knows how to work with e-commerce businesses. Our consultants will be there to make sense of your metrics so that you can make data-driven decisions.

Delight your customer. Happy customers pay more, more often.

Learn how Customer Journey by Opentracker can help boost your sales!

Click to book a discovery call today:

Schedule A Call


The Customer Is King – Busting The Myth

, ,

The Customer is King – Busting the Myth

Bad Clients

Clients are the lifeline of any business as demonstrated by the adage “The Customer is King”, — a corporate mantra that places the client at the center of business success. 

customer is king

Prominent gurus encourage businesses to  shower their customers with attention and pampering. As a result, most businesses find it hard to say “no”. Bad clients can wreak havoc on your business. Metrics such as the cost-per-acquisition (cpa) or the average time spent will suffer.

The best defence? Ensure that your business is not attracting bad clients to begin with! 

How do we do this? By understanding your online customers’ behavior, making informed business decisions backed by reliable data, and tailoring your marketing and buyer journey to ensure the right message is conveyed to the right audience at the right time.

The first step is to build a selection of ‘bad client avatars’ and avoid them in future. The following are examples of the types of bad clients to avoid.

The “Unreasonable”

Unrealistic expectations or demands. Never satisfied. Very challenging. “Unreasonables” put pressure on your resources and drain morale.
Tip: it’s important to set realistic expectations in the buyer journey so the potential buyer knows what to expect. Buyer journey insights will help accomplish this.

The “Low-Baller”

Low-Ballers are looking for the lowest price possible. They are not interested in quality or value and are frustrating to work with as they are only interested in the cheapest options. Identify your target market’s income bracket and ensure that your ads and content target your market.

The “Flake”

When you’re marketing your business, cost-per-click is everything. Avoid attracting clicks from people who are not interested in your product or service. Flakes are time-wasters who click on your ads without any intention of buying anything. They might be curious, or they might just like clicking on things. Flakes increase your cost-per-click without bringing any value to your business. The best way to avoid attracting Flakes is to create ads that are relevant and targeted to your ideal buyer persona. If you’re attracting a lot of clicks but not getting many conversions, it might be time to reassess your targeting strategy.

Opentracker allows you to identify the types of clients who are visiting your website and understand their behavior in real time. This insight empowers you to optimize your strategy and buyer journey to ensure that you are attracting the right kind of attention from the right people. Bad clients can have serious effects on your business, so it’s important to be able to identify them early on. By using Opentracker to understand your online customers’ behavior, you can make sure that you’re doing everything you can to weed out bad customers, improve buyer experience, and increase your conversion rates.

Click to book a discovery call today!

Everything You Need to Know About Customer Journey Map

,

Everything You Need to Know About Creating a Customer Journey Map

Customer journey maps are one of the most important tools that businesses can use to understand their customers. A customer journey map is a visual representation of the customer’s experience with your business, from the moment they become aware of your brand to the point where they become a repeat customer. In this article, we will discuss what customer journey maps are, why they’re important, how to create your own customer journey map, and how to use a customer journey map to improve your marketing strategy.

customer journey map


What is a customer journey map and what are its benefits?

As we mentioned, a customer journey map is a visual representation of the steps that a buyer takes to become a loyal customer. By mapping out the customer’s journey, businesses can identify areas where they can improve the customer experience and make necessary changes to their marketing strategy. Additionally, customer journey maps can help businesses understand what motivates their customers and what barriers they face when trying to purchase a product or service. It allows a business to gain insight into customer perceptions and experiences at every stage of the customer journey.

There are several reasons why customer journey maps are so important for businesses. First and foremost, they help businesses to understand their target audience better. By understanding the customer’s needs, wants, and motivations, businesses can create a marketing strategy that is tailored to the customer’s unique perspective.

Additionally, customer journey maps can help businesses to identify potential areas of improvement in their customer service. By unpacking and understanding the customer’s experience, businesses can make changes to their processes in order to improve the overall customer experience and build lasting relationships.

Finally, customer journey maps can help businesses to create more targeted marketing campaigns. By doing the work to understand the customer’s thoughts, feelings, and motivations at every stage of the journey, businesses can create marketing campaigns that are more likely to speak directly to their target audience and convert leads or once-off visitors into lifelong customers.

How to create a customer journey map for your business

The first step is to identify your business’ goals. What do you want to achieve with your customer journey map? Do you want to improve your customer service? Do you want to create more targeted marketing campaigns? Knowing what your goals are upfront will allow you to create a customer journey map that is filled with the information you need to take actionable steps towards improving your outcomes.

Once you have identified your goals, you need to gather data. This data can come from a variety of sources such as customer surveys, interviews, focus groups, and customer service logs. Using an intuitive software like Opentracker to track your website traffic will give you valuable insight into how customers interact with your site so that you can identify exactly where you need to make changes to improve their experience.

Once you have gathered your data, it’s time to start mapping out the customer journey. Begin by creating a list of all of the potential touchpoints that a customer might have with your business. These touchpoints can include everything from becoming aware of your business and first interactions to purchasing a product or service and becoming a returning customer. Break down each touchpoint into smaller steps, so you can really see the detail in the journey start to emerge.

Once you have listed out all of the potential touchpoints, you need to create a timeline of the customer’s journey so that it is a logical progression. Include both the positive and negative experiences that the customer might have along the way. Additionally, be sure to include the customer’s emotions and reactions at each stage of the journey.

After you have created your timeline, you need to start adding detail to your map. Include information such as the customer’s needs and wants at each stage, the steps they might take to progress in the journey, and the channels they use to interact with your business at every stage.

Finally, you need to analyze your customer journey map. What does it tell you about your business? Are there any areas where you can improve the customer experience? Are there any areas where you need to make changes to your marketing strategy? By analyzing your customer journey map, you can gain valuable insights into your business and make the necessary changes to improve your customer’s experience and target your advertising and campaigns.

What are some common mistakes businesses make when creating customer journey maps?

One of the most common mistakes businesses make when creating customer journey maps is failing to include all of the potential touchpoints. It’s important to remember that customers can interact with your business through a variety of channels, so be sure to include all potential touchpoints in your map.

Additionally, businesses often make the mistake of failing to include the customer’s emotions in their customer journey maps. Customers have emotional reactions to every stage of their journey, and your map should reflect each one of them so you can have a complete picture of the customer’s experience and be ready to respond accordingly.

Obtaining data can also be a major challenge for businesses. While there are a variety of data sources available, it can be difficult to gather all of the necessary data and analyze it correctly. As a result, businesses often make decisions based on incomplete data, which can lead to sub-optimal results. To avoid this mistake, it’s important to work with a team of experts who have experience in obtaining valuable, real-time data that you can rely on to make informed decisions.

Opentracker allows you to track your website traffic in real-time so that you can obtain the data you need to create an accurate and actionable customer journey map. Our software empowers you to automate your customer journey reporting so that you can improve efficiency and maximize your resources. With direct access to our data analytics team, you can be confident that the data you’re using to create your customer journey map is realiable and will form the foundation of one of the most useful assets your business can own – a full picture of your customer’s journey that is ready for you to act on.

Increase the bottom line with Offline Attribution Metrics

, ,

Increase the bottom line with offline attribution metrics

Offline attribution has always been a measurement challenge. We use the example of a company we work with; StudyPoint, founded in Boston in 1999, deliver consistent and reliable academic and test prep results to families alongside individualized needs assessments and online homework tools.

By ‘offline attribution’ we mean the measurement of an important event that takes place offline.  For clarity: this as opposed to online events which are relatively simple to measure: ad clicks and campaign clicks are easy to collect through utm tagging Other examples of online touchpoints which can be measured are: contact forms and sign-up or login events, downloads, webinars, podcasts, and app visits. 

The most common examples of outreach which are difficult to measure are telephone calls, billboards, radio magazine and newspaper advertisements, and direct conversations at conferences and events. 

It is important to know how these types of outreach perform because knowing what is effective determines budget spend. Without insights, there is guesswork involved.

The problem is that, if at any point in the workflow, an offline activity takes place, this disrupts the entire measurement flow. Specifically the ability to attribute success (conversion) to a channel (source and medium). Another example is knowing which materials are converting visitors prospects or leads. Read about conversion and ROI here.

The goal in attribution is to measure which marketing efforts are having the best effect. This information tells you how to allocate your Marketing spend.  

For this article, we have chosen an example of a company for whom we designed a workflow that takes offline attribution into account and delivers a KPI-metric that can be measured.  Please get in touch with us if you would like to learn how we can solve this problem for you. 

Our case study involves a company that provides tutoring for children. StudyPoint is in the business of helping kids achieve their academic goals through personalized, one-on-one tutoring programs.

In this case one type of client (the parents) make arrangements for children (end-users). So there is immediately some complexity as there are a minimum of four parties involved (StudyPoint team, parents, students, tutors).

Because it’s a high ticket offer and the parent/ caregivers want to know who is tutoring their child, one or more phone calls take place. 

In terms of conversion, during the phone call the payment details are arranged. Once the offline event, i.e. the phone call, has taken place, the measurement of touchpoints can resume. 

Solution: we designed and deployed a seamless workflow to capture all activities and generate automated reporting.