How to write a Privacy Policy for your website

,

How to write a Privacy Policy For Website


Summarised overview

In this article you will find steps and information on:

  • Defining a privacy policy
  • Why you should have one
  • Guidelines for creating a policy
  • A sample privacy policy specific to setting cookies, and a
  • Link to an automated policy generator

Step 1: Explain what the privacy policy is addressing

A privacy policy is a document telling visitors to your site what information you collect and what you do with that information. Very simply: it is a short explanation of what you are doing to observe visitors to your website.

Step 2: Define your Cookie Specific Privacy Policy:

  1. What cookies are?
  2. What info is collected?
  3. What is done with the information?
  4. How to reject / delete / accept cookies?
  5. Explain that there are no harmful technical consequences/ risks

Two good reasons to develop a privacy policy for website

  1. Create a better electronic environment on the internet
  2. Laws / legislation may pertain to your business

By letting people know what info is collected and what is done with that information, you can create a transparent environment in which people / consumers are more confident. You can eliminate stress and concerns about abuse of personal info.

Various legislations and legal guidelines, for example in the US and in the UK, are being developed and may affect your website, depending on what information you collect, how you do it, and what you do with it. The European Union has developed similar guidelines that contain a bit too much legal rhetoric to be completely useful.
See resource list below for reference websites.

Step 3: Formatting an Online Privacy Policy

Your policy should be written in plain readable language. Consider the policy to be a part of your site. Design the policy and publish it like the rest of your site. Design it as if you actually want people to read it. Make it short, friendly & intuitive. It should be easily accessible throughout your site.

A Sample Privacy Policy

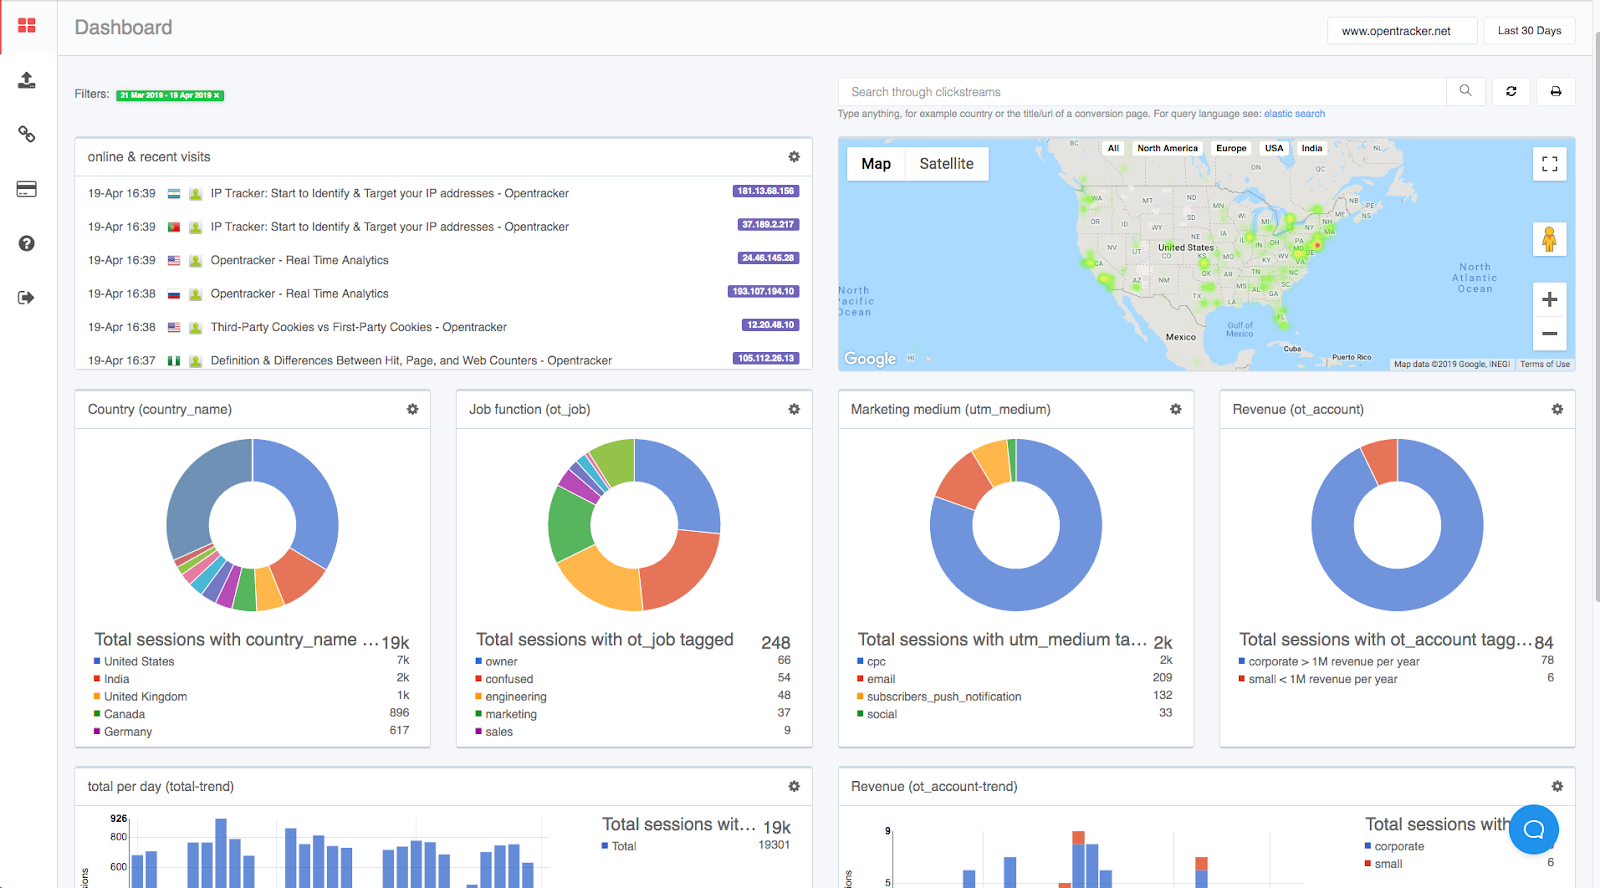
www.mysite.com uses www.opentracker.net to collect visitor data and analyze traffic on our site. This information helps us understand customer interests and helps us improve our website. When you visit our site, the pages that you look at, and a short text file called a cookie, are downloaded to your computer. A cookie is used to store small amounts of information. This information is collected for traffic analysis only. The cookie does not contain personal details. Depending on the browser that you use, you can set your preferences to block/ refuse cookies, and/ or notify you before they are placed. Opentracker does not sell, give, or trade the statistics they store to any 3rd parties for data-mining or marketing purposes. Please visit www.opentracker.net for their privacy policy.

Step 4: Design your privacy policy for your website

Tell your visitors why tracking cookies are good, why the information is beneficial, that it is used to improve websites and their content. Give an example. If you are collecting information, tell them what you do with that information. Give people an opportunity not to have their info collected, for example by blocking cookies. Explain how people can block cookies. Also explain that cookies are not harmful and cannot introduce viruses or extract personal contact information.

Why all the fuss?

There is an important distinction to be made here between cookies and spyware. Spyware collects information about your surfing habits across the internet and sends this information out from your computer. Cookies collect information about your surfing habits only on the site of the provider of the cookie, in other words just on one site.

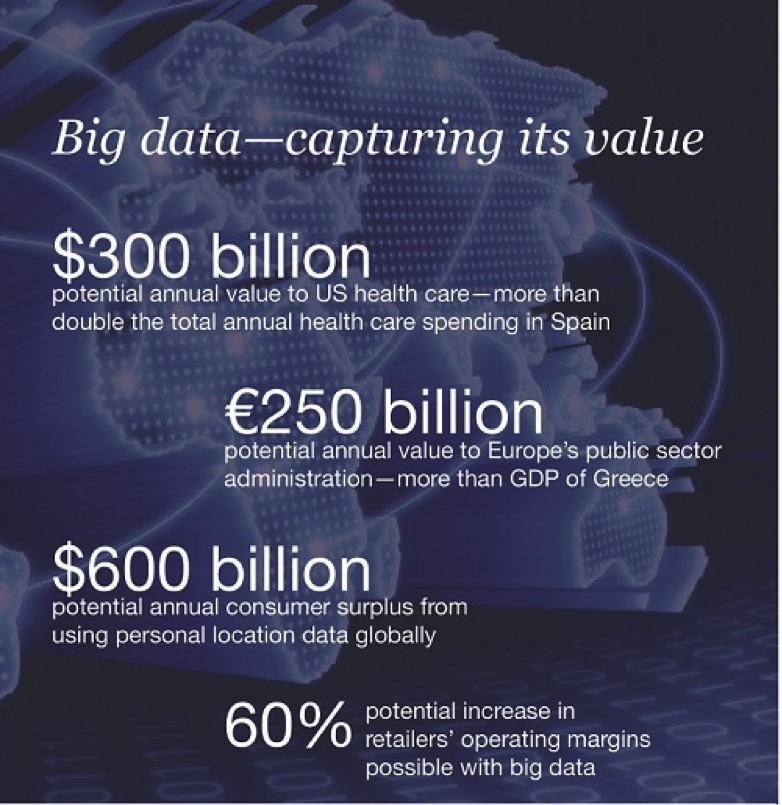
From our research it appears that most people are concerned that their personal information may be passed on. In this case, there is an important distinction to make between Two Types of Information which are collected:

  1. Personally identifiable info/ personal contact info
  2. Clickstream/ navigation info

Specific to concerns about cookies, the information being collected does not contain personally identifiable information. Clickstreams are used to see if people return to the same sites, and identify patterns.

When databases are combined, for example a membership & login base, with a clickstream tracking system, it is possible to combine personal information, such as an email address, with clickstreams. This is where the main cause for concern seems to lie.

The companies that do this; with the resources to combine clickstreams, past purchases, and personal information, are household names, such as amazon.com, ebay, bbc, yahoo, etc.

Further Reading

We also recommend taking a look at the privacy policy of a company or website that you like or respect to see what information they consider to be important.

Here is a privacy policy generator where you can also find information about legislation:

https://privacypolicygenerator.info/

Legislation in the UK:

https://www.cookielaw.org/the-cookie-law/

Obviously there is a very real concern for a lot of people that their privacy is being abused. We would like to respond to these concerns, primarily through education, but also by opening up a dialogue on any related questions or ideas. Please feel free to write us, or post feedback on our support center.

Third-Party Cookies Vs First-Party Cookies

,
Start your free, no-risk, 4 week trial!

Third-Party Cookies vs First-Party Cookies

Executive Summary and Article Navigation

Discussion and definitions of:

Who wants a cookie?

What are cookies? Here are a few over-lapping definitions;
  1. A small data file placed on your computer by a website that you visit.
  2. A piece of code placed in your browser by a website server.
  3. A text file placed on a hard drive to store and transmit information to the server of websites (re)visited from that browser / computer.

What is a (third-party) cookie?

A cookie is a small bit of text placed on the hard drive of  your computer by the server of a website that you visit. The cookie is placed there for the purpose of recognizing your specific browser or remembering information specific to your browser, were you to return to the same site.

All cookies have an owner which tells you who the cookie belongs to. The owner is the domain specified in the cookie.

In “third-party cookie”, the word “party” refers to the domain as specified in the cookie; the website that is placing the cookie. So, for example, if you visit widgets.com and the domain of the cookie placed on your computer is widgets.com, then this is a first-party cookie. If, however, you visit widgets.com and the cookie placed on your computer says stats-for-free.com, then this is a third-party cookie.

Opentracker provides services that allow the companies and websites to track their visitors with first-party cookies.

Growth of third party cookie rejection

Reports and research on the subject of website tracking tell us that the rejection of third-party cookies is growing. Increasing numbers of people are either manually blocking third-party cookies, or deleting them regularly.

That is why Opentracker utilizes 1st party cookie technology.

The cookies being deleted / blocked are third-party party cookies, as opposed to less problematic first-party cookies.

How many people or software tools delete third party cookies? The numbers given can be as high as 40%. If you count that many anti-spyware applications and default privacy settings also block 3rd party cookies, then it is possible that a high percentage of cookies are being blocked.

Blocking and deleting cookies

Why do far fewer people block first-party cookies? It is estimated that a very low percentage of people block first party cookies, less than 5%. The reason for this is primarily that it is very difficult to surf the internet without accepting these cookies. First party cookies are necessary in order for you to be recognised as an individual. Any site that you login to as an individual requires a way of identifying you as “you”. Hotmail, Yahoo, Gmail, online banking, ebay, Amazon, etc.

Additionally, anti-spyware software and privacy settings do not target first-party cookies.

visitors online
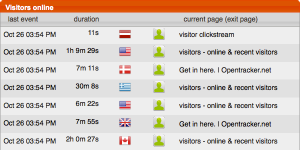
We use cookies to keep track of long-term visitors. These visitors remain anonymous, the point is to be able to see who returns, if and when, for example, for conversion analysis.

We use first party cookies as our first line of analysis, and ip number with user agent as the secondary line. AOL users are identified more specifically because their ip number changes with every click.

What actually happens when cookies are blocked / rejected?

1st party cookies: it is very hard to login anywhere

3rd party cookies: no adverse effects to surfing

Q: How does this affect tracking systems, when people block / delete cookies?

A: All visits will still be recorded, but a person who has deleted the cookies will not be recognised as the same (returning) visitor.

When cookies are in place, and not blocked or deleted, total visitor counts will remain comparatively low. If a person constantly deletes cookies, they will be counted as a new “unique” visitor with every subsequent visit.

Conclusion

In response to these trends, the first step is to find out if the statistics that you collect utilise first-party or third-party cookies. Ask your statistics or tracking company. Asking questions usually leads to more questions, always a good thing when it comes to gathering and analysing data.

Capture Perfect Customer Profiles With Easy Tool

,

A Modern Customer Profile Template For Smart Businesses

Please try our social profile login by visiting here

Marketers and businesses who use customer profile templates are smart. They know customer profiling helps them target their ideal customers accurately.

A customer profile template is a document that helps you detail critical information about your target customers. You use this information to run marketing campaigns and reach your target audience.

Frankly, you can’t keep all the helpful info about target customers in your head.

From their name, interests, down to even their religion — whatever you can think about your customer, include it in the profile.

Why? The more specific your customer profile, the better your marketing campaigns can reach your target audience.

Here’s a customer profile template you can use for your business:

customer profile

Click on this Customer Profile Template to download it, so you can fill in each column while you read on.

Now, let’s break down all the elements in the customer profile template one by one:

Four critical bits of information to build your customer profile

1. Customer demographic information.

This is market segmentation according to characteristics like age, gender, ethnicity, race, religion and education.

customer profile

This part of customer profiling helps you to anticipate customer behaviour.

The more you understand key demographics data about your customers, the better you get at determining their behaviour and designing products, services, or content that they’d find useful.

For example, an alcohol company marketing expensive drinks should only market their products to age groups above the legal drinking age who have the financial capacity to afford the products being marketed.

If your customers are within the 24-30 age range or are married with children, apprise yourself of the interests of people in that demographic, and use that information to create campaigns and products they truly value.

This brings us to the next piece of information you should consider when creating your customer profile.

2. Customer geographical Information

Your customers’ geographical information helps to segment target buyers by location so you can better serve them in a specific area.


customer profile


For example, if 70% of your customers come from London, you have no business running marketing campaigns that target people too far from that region.

But geographical information in customer profiling is based on (but not exclusive to) three major factors:

  • Geographical units:

Based on specific geographical units such as countries, cities, etc.

  • Climate:

This is segmentation that involves an expanse of land with the same environmental factors (Sub-Saharan, Pacific Coast, the Caribbean, etc.)

  • Cultural preferences:

Concerning a society’s ideas, customs, tastes, and social behaviours.

You need to mark these geographical differences in your customer profile — because people in different locations are bound to exhibit different traits and have a variety of ideas, culture, needs and wants.

So your customers’ geographical location plays an integral role in customer profiling.

More importantly, geographically segmenting your audience strengthens your marketing campaigns.

Chances are high you’ll have to create ads at some point, and advertising platforms (Facebook, Twitter, LinkedIn, etc.) will require you to provide them with your audience’s location(s) so they can better serve your campaigns to people who will be interested in them.

The more accurate the information you give them, the better they can serve your ads in locations where your customers are.

3. Customer psychographic information

Psychographic information deals with people’s hobbies, interests, and all the things they like or don’t like to do.

customer profile

Psychographics are usually confused with demographics but they’re two different creatures with their own nuances.

Demographics cover things like:

  • Age: 18-24; 25-30
  • Marital status: married or single
  • Gender: male or female
  • Parental status: with or without children

While psychology covers things like:

  • Habits: shopping behaviour, time spent on social, etc.
  • Lifestyle: loves partying, introverted, etc.
  • Interest: follows X influencers, TV stations, books, politics, etc.
  • Values: family, religion, etc.

Difference between demographics and psychographics

CB Insights designed an infographic that demarcates the difference between demographics and psychographics:

customer profile

In essence, demographics speak to who people are naturally, while psychographics speaks to how people behave, their personality and their emotional triggers.

So the psychographic section of your customer profile helps you identify your customers based on their interests, values, lifestyles and personality traits. And this will enable you to better develop and market products that match your customer interests, hobbies, and values.

Put another way, customer psychographics put more emphasis on your customers’ psychological factors, while focusing on only behavioural qualities as opposed to raw data as you acquire demographics data in your customer profile.

4. Socio-economic customer information

This is a type of demographic classification that examines the aspects of income, occupation and household description.

customer profile

You should consider certain fundamental variables when creating the socio-economic segment of your customer profile.

These socio-economic segment elements include:

  • Income: wages, salaries and any other source of earning flow. When creating your customer profile, consider your target customer’s average income. Know if your potential customer has the expendable income for your product or service. Know whether your product is indispensable to your customer.
  • Education Level: What level of education does your ideal customer have? Does it suggest anything about their relationship with your product?
  • Occupation: Are your customers employees or business owners? Does the customer’s job have anything to do with your product? If yes, does it facilitate their use/need of it or not?
  • Home Environment: Where does your primary target audience live? What are the key characteristics of their area, city or state? Does their home environment suggest they might be in a particular economic class? What notable influences does the home environment have on the customer?
  • Household Description: Consider the size and description of your customer’s household. Are your customers, on average, married with kids? Are they single, living with a partner or engaged?

That’s not all. You should further divide the socioeconomic segment of your customer into socio-economic classes (SEC) — which is a social classification that’s based on occupation.

Your chances of meeting the needs of your ideal customer and selling products or services they can afford become significantly higher when you understand what level of the socioeconomic class they occupy.

One of the most popular formats used to divide socioeconomic classes is the social grading system created by PAMCo. This system, according to PAMco, has been the research industry’s source of social grade data. The system provides a statistical socioeconomic diversification of households in six main classes.

The six main classes are:

  • A – Upper Class: Higher managerial, administrative and professional, such as executive directors, doctors, lawyers, and all high-end employees.
  • B – Middle Class: Intermediate managerial, administrative or professional position.
  • C1 – Lower Middle Class: Supervisory, clerical and junior managerial, administrative and professional.
  • C2 – Skilled Working Class Skilled Manual workers, such as construction workers, and so on.
  • D – Lower Working Class: Semi and unskilled Manual workers, such as mechanical trainees, or shop workers.
  • E – the Lowest Level Of Income Earners: State pensioners, casual and lowest grade workers, students and unemployed with state benefits.

How to get accurate customer profile data

You could guess all the customer information you need or you can view real analytics of the people who have been visiting your site. The latter is clearly the better option.

And this is where Opentracker comes in. Opentracker is an analytics tool that lets you track your website visitors and collects accurate data about them.

customer profile

You get all the customer profile information you need, including:

  • Customer socioeconomic information: Your visitors’ average income, the company they work for, their job roles, etc.
  • Psychographic: See how your customers respond to your campaigns. Do they flinch at products or services within a particular price range? Do they get sceptical and start asking questions? Or do they just buy it once they’re convinced it’s a good deal for them? You can find these answers and more with Opentracker.
  • Geographical information: Where (locations) your traffic and highest converting traffic comes from.
  • Custom data: You can search for data that’s specific to your business: With Opentracker we build data-driven customer profile’sSchedule a call to find out how.

Marketing Campaigns: Creating Highly Effective Promotions

,

Facebook Ads Vs Google Ads Vs Instagram Ads Vs Linkedin Ads: Which will get you better ROI

It’s no news that Advertisement has a huge impact on sales. Digital Advertising has made it a lot faster, easier and cheaper to advertise your products.


With the number of internet users being on a steady rise at 11 users per second daily, online advertisement is now one of the biggest ways to promote your products and table your offers. It should definitely be part of your content promotion plan.

The bottleneck with Digital Advertisement is picking the right platform to use, one that would give you the best returns.

It would be refreshing to know the platform with the best ROI for your business. 

Many Digital Marketing Experts have pounded on this, and after interviewing four digital marketing experts the answer still remains the same – it depends,  not the answer you’re looking for but read on.

Picking the best platform for your business depends on a number of factors, like the kind of business, the goal of the business at that given time and your budget. This is because these applications were launched at different times, for different purposes and dissimilar consumer profiles.

In this article, we’ll make the task of choosing or not choosing a platform less daunting by giving you an actionable strategy to use when choosing an advertising channel and also by comparing Facebook, Google, Instagram, and Linkedin Advertising Platforms; based on their features, cons, pros, most expensive, the platform with the most views and benefits with respect to years of research and experience of Digital Marketing Gurus.

Comparing Facebook, Google, LinkedIn and Instagram Ads.

The Ad Formats

Google

With Google Ads, you can target ads based on what users are searching for on Google, your ad can be in the form of text, image, video or call. You can also narrow who sees your ad by adding age, gender, demographics and country. 

  • Text: You can advertise your product or service by targeting search keywords and phrases. For instance; if you’re a legal lawyer in California looking to advertise your service on google. You target keywords such as “legal lawyers in California” or “I need a legal lawyer in California”. So when someone searches for the picked term your ad shows on the result page like so; 

With google text ads choosing the right search term to target for is prime. You want a phrase with the right volume and audience for your business.


  • Image: You can use static or interactive graphics or animated ads(.gif and flash format) to place your ads on businesses that partner with google on their website or app. 
  • Video: Google places your video ad on YouTube or across google’s video partner sites depending on your goal, settings, and type of content you want to promote.


  • Call:  Google drives phone calls to your business with ads that include your phone number. People can click on these ads and then call your business directly.                    
  • Product cart Ads: Your Ad will be displayed to people shopping online for that product or related products.                                                   

Facebook

With Facebook , You can target Facebook ads based on their age, gender, languages, activities they perform on the app, or lookalike audience (ie profiles that are identical to your existing customer profile.).With Facebook ads, you can showcase your ads using an image, video, carousel, slideshow, instant experience, and collection.

  • Photo: Facebook allows you to show engaging photos on your targeted user’s feed, stories or even their Facebook messaging platform.


  • Video: You can showcase a video ad to your target profile on their feed or story. 
  • Playables: Playable ads offer people an interactive preview on Facebook before they download an app.

  • Instant Experiences: formerly known as Canvas, allow you to create a full-screen, fast-loading destination designed for mobile and add them to almost any ad format.

  • Slideshow: Slideshow ads are video-like ads made of motion, sound, and text.
  • Carousel: Carousel ads let you showcase up to ten images or videos in a single ad, each with its own link.

LinkedIn

You can target LinkedIn ads based on location, company name, company industry, size, the school they went to, years of experience of a particular skill, gender, target groups, and age.

  • Sponsored Content: This Ad type appears alongside content LinkedIn members curate for themselves. You can think of them as promoted posts, as they are essentially amplified versions of the links, media, or messaging you would normally share through your Company Page.
  • Sponsored InMail: You can use this feature for sending personalized messages to highly targeted recipients. Sponsored InMail only delivers to active LinkedIn members, there is no need to worry about messages bouncing or landing in abandoned inboxes. You can tailor your content directly to the audience, and a responsive design ensures that your CTA button is always visible on any device.
  • Text Ads: Linkedln displays this ad on the side rail or inline. It is only shown to desktop LinkedIn users.

Instagram

Instagram ads are identical to Facebook ads. You are able to target profiles based on demographics, gender, interest, behavior, lookalike audience, custom audience(people you know by inputting their email or phone number), automated targeting(they create a profile based on people they think would be interested in your product by their activities on the app). Their Ad format is the same as Facebook. Using Images and Videos on feed or story, Carousel, etc except for instant messaging instead they offer “ explore ads”.

  • Explore Ad: Showing ad Videos or images to people when they are on their Instagram explore page.

Average Cost.

The Average Cost depends on how much you are willing to spend. You have the ability to set a limit on the amount you want to use and see the result it will get you then decide if you need to invest more money or not.

Google: The average cost-per-click (CPC) on Google Ads is $1 to $2 for the Google Search Network and less than $1 for the Google Display Network(Advertising with google partners).

Facebook: If you’re measuring cost per click (CPC) Facebook advertising costs on average about $0.27 per click. If you’re measuring cost per thousand impressions (CPM), Facebook advertising costs about $7.19 CPM.

LinkedIn: On average, businesses pay $5.26 per click and $6.59 per 1000 impressions, as well as $0.80 per send for Sponsored InMail campaigns.

Instagram: On average, Instagram advertising costs between $0.20 to $6.70. For CPC or cost-per-click, advertisers pay $0.20 to $2 per click. For CPM or cost-per-impressions, advertisers pay $6.70 per 1000 impressions.

Audience Volume and Views.

Knowing the user volume and average views of an advertising platform is not so important. This is because their volume and views do not determine their user engagement rate with your ad.

I mean you won’t want to advertise on a platform with 0 views but even if a platform has 20,000 views and another has 200,000, your decision should still be based on if these views include your target audience because if not, you are advertising to people who are not interested in your product or service. In other words, you are wasting your time. You can advertise on a platform with 200,000 views and your conversion rate will be 0.1% and on a platform with 20,000, your conversion can be 2% depending on your customer profile.

Google: Google now processes over 40,000 search queries every second on average which translates to over 3.5 billion searches per day and 1.2 trillion searches per year worldwide.

Facebook: Facebook has a total of 2.5 billion monthly active users and 500 million Story viewers.

LinkedIn: LinkedIn has 627 million monthly users and 40% of monthly active users use LinkedIn daily.

Instagram: Instagram has 1billion monthly active users, 500 million+ story views daily and 4.2 billion photo likes per day.

Average Conversion Rate.

The conversion rate is the number of conversions divided by the total number of visitors. For example, if a site receives 200 visitors in a month and has 50 sales, the conversion rate would be 50 divided by 200, or 25%.

Facebook: Facebook has a conversion rate of around 9.21%, which is very high with respect to the number of users they have monthly.

Google: Google’s average conversion rate hovers around 3.48% for search ads, and .72% on the display network. Display ads, therefore, are really best suited for strong campaigns.

Linkedln: Linkedln has a conversion rate of 6.1% for sponsored posts, 3.48% for text ad and 2.5% for Inmail ads.

Instagram: Instagram has a conversion rate of 1.08%.

Average Click-through Rate.

Click-through rate is the rate at which your ads are clicked. This number is the percentage of people who view your ad (impressions) and then actually go on to click the ad (clicks). The formula for CTR looks like this:

(Total Clicks on Ad) / (Total Impressions) = Click-Through Rate

Google: Currently, the average click-through rate for search ads on Google is 1.91%. Whereas the average click-through rate for Google’s display network(Google partner websites, videos, and apps) is 0.35%.

Facebook: The average click-through rate for Facebook is 0.9%

LinkedIn: Presently, the average click-through rate for search ads on LinkedIn is 4.1% for text ads and 0.39% for sponsored content. LinkedIn is improving rapidly, hence the ctr is subject to constant change.

Instagram: The current average click-through rate for Instagram ads is 0.52%

Audience Type.

Google: Google’s audience type varies, old, young people all “google it”. Before advertising with google, the one time you ought to do is check the search term with the best ROI for you. This guide can help you.

Facebook: Facebook is actively used by individuals between 29-65 years, mostly college graduates. It’s a good place for B2B advertising, eCommerce and service-based ads.

Linkedln: Linkedin comprises majorly by individuals looking for job opportunities and others offering jobs and rarely for personal use, with their ages between 20- 50 years. It’s best for B2B content, Finance and it wouldn’t be so good for eCommerce.

Instagram: Instagram is used majorly by a younger audience, focused on small scale businesses, eCommerce and lifestyle.

Usability.

Ease of use is subjective and shouldn’t discourage you from using any advertising platform before using it yourself. According to reviews and digital experts; Facebook ads are the easiest to set up followed by Instagram, then google and finally Linkedin. Below are youtube videos on how to easily navigate and set up Ads on these platforms by Gurus in each field. Google Ads, Facebook Ads, Linkedin Ads and Instagram Ads.

Customer Support.

This is important because anything can happen and it’s paramount that you are able to get reliable and fast support when it’s needed.

Google: Google has a customer support number which makes it very fast and you can also fill out their customer support forum to leave a message on their ad forum.

Facebook: You receive help from Facebook by visiting their help center where they have FAQs and also leave a message on their Facebook help community.

Instagram: You are able to reach Instagram by visiting their help center where they have FAQs and also leave a message in their support forum.

Linkedin: You can contact LinkedIn by going to their help center for FAQs and also by leaving an email for them to respond to.

According to the data above, Google has the best customer support then Linkedin followed by Facebook and Instagram.

Retargeting.

Retargeting is a form of online advertising that can help you keep your brand in front of bounced traffic after they leave your website. For most websites, only 2% of web traffic converts on the first visit. Retargeting is a tool designed to help companies reach the 98% of users who don’t convert right away.

All the above-mentioned platforms (Google, Facebook, LinkedIn, and Instagram) have the retargeting function. Giving you the ability to show an ad again to someone that took an action on the ad the previous time.

Here’s a simple strategy you can use to pick an online advertising platform.

  1. Using a Software Program like Opentracker, you are able to track where your existing customers/visitors are coming, you can also see the search keyword, word or phrases that drove them to your site.
  1. Using an eCommerce Teenage Thrift Store as an example;
  1. Know your Audience base: Having a customer profile and picking the right search term is very important here because it’s the base of everything that follows. Most thrifters are between the age of 13- 30 and mostly female.
  2. Have a business goal: Their goal at this point is to get more awareness and conversion.
  3. Check Each Platform for the one with the highest search volumes on multiple keywords for your company.

Instagram


LinkedIn

Google


Facebook


In addition: You also check for the click-through rate and conversion rate for your keyword and your company type on each platform.

  1. Pick one or two at first based on the highest search volume and the goal at that point: Based on the results above as the thrift store digital marketer I will run ads on Instagram because of the search volume and age brackets of Instagram users and I’ll also invest in google to see which one gives a better return. If it were a thrift store I’ll invest in Facebook, Google and/or Instagram and track the results depending on my ad budget.
  1. Get an Expert or self-study the platforms.
  1. Budget Wisely.
  1. Track the results.

Concluding Thoughts:

Deciding to utilize Online Advertising can make or break your business.

All platforms can give you high or no returns depending on how you use it.

Implementing the tips and strategy shown in this article would help you choose wisely.

How Quality Service Affects the Buyer and Customer Journeys

,

How Quality Service Affects the Buyer and Customer Journeys

The importance of quality service cannot be overstated. Quality service affects both the buyer’s journey and the customer’s journey. It is essential to the success of any business.

Establish Trust

The first of these is, of course, the initial contact a potential buyer has with a company. If this contact is positive and the potential buyer can recognize value in your offering, they are much more likely to continue considering your company as an option. Quality service at this stage helps to build trust, which is an essential building block for any business relationship. Showing social proof can help to garner trust and increase confidence in potential buyers, as they can see that others have had positive experiences with your company. Additionally, showing insight into your target audience’s pain points and addressing them with top-tier, personalized customer service can make all the difference.

Cultivate Relationships

The next pivotal moment where outstanding service can make a real impact is during the sale itself. If a potential buyer feels like they are being treated fairly, listened to, and that their business is valued, they are much more likely to make a purchase and become a loyal, lifelong customer. Once again, this comes down to trust; if a buyer feels like they can trust a company to deliver on its promises, they are much more likely to do business with them. 

Build Loyalty

The journey doesn’t end once a buyer has made a purchase, of course. In fact, it’s only just beginning, and is now considered the customer journey. The objective is to turn once-off buyers into repeat customers, and quality service is essential to making this happen. This is about personalizing the customer experience to ensure that it is tailored to their specific goals and preferences. Collecting this data along the way is, therefore, essential.

Maximize Sales

Finally, dealing with repeat customers is potentially the most overlooked opportunity for quality service. Just because a customer has already made a purchase or a series of purchases, it doesn’t mean that they are no longer important. In fact, repeat customers are often some of the most valuable, as they are likely to spend more, more frequently. Following up with repeat customers to thank them for their business and see if there is anything more that you can do for them is a great way to show that you value their loyalty. 

Quality service is not a one-time event; it’s an ongoing journey that should be consistently improved and refined to ensure the best possible outcome for both your customers and your company.

Opentracker allows you to track your customer journey in real-time, creating automated reports that give you detailed insights into every stage of the process, make data-driven decisions on how to improve service and maximize sales. 

3 Ways AI Will Transform Marketing & the Customer Journey in 2023

,

3 Ways AI Will Transform Marketing & the Customer Journey in 2023

In the early days of the digital age, responding to a customer’s comment on social media was enough—but those days are long gone. To remain competitive in today’s online landscape, businesses are changing their approach from offering customer service to being customer-centric.

This means the customer should be the focal point of the entire experience, with each touchpoint tailored to create lasting satisfaction. Positive experiences lead to loyal customers, but implementing a customer-centric approach across all touchpoints can be challenging for businesses that take a manual approach to their customer journey.

Over the past few years, artificial intelligence (AI) has advanced to the point where it now has the power to provide an enhanced and intelligently informed customer experience. Using machine learning (ML) and natural language processing (NLP), AI for customer service can solve issues without human intervention—but it can also do much more. Keep reading to discover how AI will transform the customer journey in 2023 and beyond.

1. Deliver a Personalized Customer Experience

For a truly customer-centric experience, brands need to design each touchpoint of their journey to effectively engage and convert their audience, and AI is making it more seamless than ever.

Targeted Offers

When you combine CRM, behavioral psychology, and AI, you can utilize user data to deliver personalized offers, messaging, content, and rewards that enhance the customer journey and cultivate brand affinity.

24/7 Convenience

Every marketer knows that convenience is the key to customer satisfaction. AI-powered customer service chatbots provide real-time assistance and proactive solutions that keep potential customers engaged and satisfied. 

AI Insights

AI can offer your organization behind-the-scenes support by equipping your service team with access to vital information. For example, if a customer wants to know about payment options and product information, AI can seamlessly pull up these resources so your service agent can focus their attention on the customer.

2. Save Valuable Time and Resources

Creating content that connects with your customer is a vital touchpoint of the customer journey—but producing high-quality content can become prohibitively time-consuming, especially if you’re a start-up or small business. Recent advances in AI-powered content generators empower you to create and rewrite content at lightning speed without needing to hire additional resources. Some of the leading AI content generators in the market today offer features such as blog title suggestions, SEO keyword planning, topic research, image sourcing, and content creation.

3. Enhance Cross-Channel Communication

Before the internet, customers had limited ways to contact a brand. But today, there are countless engagement channels to keep track of which can stand in the way of seamless cross-channel communication within teams. An AI-powered system can keep track of each communication touchpoint in your customer journey (e.g. calls, emails, chat) to provide analytics on each interaction, helping you build a seamless, unified journey that keeps your team on the same page while bolstering customer satisfaction.

Are you ready to harness the latest technology to enhance your customer journey? Get expert guidance from those at the forefront of innovation. Opentracker’s robust platform empowers you to automate the customer journey while providing in-depth analytics that let you continuously refine your customer experience to stay ahead of the latest digital trends.

What Web Metrics Can Do For You

, ,

What (exactly) web metrics can do for you. Fail to plan : plan to fail

Business is based on margins and profits.

In order to generate a specific profit X, there is a minimum amount of sales Y that need to take place.

Business forecast and managing a business rely on calculations. Whether or not costs are covered and sufficient revenue is generated should not be left to chance. Website and customer journey analytics are necessary to determine what is working, what is not working and how to ensure business health. Click to read about driving performance with customer journey.

In a nutshell: business and website managers need to stay on top of actual performance and make ongoing changes

Example

This is where statistics come in. For a web-based business the success of the business depends on a combination of several metrics:

  1. The amount of traffic that comes in
  2. The amount of traffic that converts
  3. The average, or total, value of the conversions
  4. Additional consideration is whether or not the revenue is recurring

The take-home is that these metrics need to be reverse-engineered to ensure that the business stays healthy and grows. Projections can be made based on historical data. Current data is then used to calculate revenue projections. Action can be taken if the numbers are not high enough.

Conversion rates tend to stabilise and do not change again, unless something else change – click to read how this works. In other words, if you receive on average 20-30 visitors per day, this will remain more-or-less constant.

Unless you increase or decrease the budget or change your marketing content you will receive a constant amount of visitors.

In a great many cases, the amount of traffic that converts (conversion rate) is also consistent or stable.

The point is that you can use metrics to:

  1. Reverse engineer (predict) how much revenue will be generated based on current and historical traffic.
  2.  Perhaps more importantly – know when the numbers are too low, when your efforts are not succeeding; and when you need to add or change traffic sources and marketing strategies.
  3. Businesses rely on predictability. Metrics measure what is actually happening and are used to calculate:
    • Predictions
    • Signals that additional actions to generate revenue need to be taken
    • Validation of continued attempts to generate both traffic and ensure that the traffic is converting. Especially as there are multiple sources of traffic, which needs to be measured per channel (see below).

The last point in this train of thought is that there are multiple channels (traffic sources) through which your customers journey:

  • New traffic
  • Existing (returning) traffic
  • Nurturing (newsletters)
  • Direct cold outreach emails
  • Blog posts and articles
  • White papers and downloads,
  • SEO campaigns with different vendors; Google, Facebook, Instagram, Linkedin, etc. 

The take-home is that (conversion) metrics and customer journey analysis tells you which of these channels are working and which data is essential to creating and managing success.

Definitions of Big Data

Start your free, no-risk, 4 week trial!

Definitions of Big Data

Q: Can you please provide me with a definition of Big Data?

A: The definition of Big Data is a moving target.

Opentracker big data definition

In order to make it possible to follow the discussion, as it evolves, we see have started a list of definitions, as we read them on the internet.

Author names: Andrew Brust (ZDNet), Bill Franks (FCW article), PCmag encyclopedia,  John Rauser (Networkworld), John Weathington (TechRepublic Blog), Cory Janssen (Techopedia.com), Mike Gualtieri (Forrester),  John Ebbert (Adexchanger), Edd Dumbill  (O’Reilly Strata), Boyd & Crawford (cited by Leslie Johnston on the Library of Congress), Tim Gasper (cited on TechCrunch), Margaret Rouse (TechTarget), Mike Loukides (O’Reilly Radar), Jimmy Guterman (O’Reilly), Wikibon,  Steven Burke (CRN), Urbandictionary .com, Slashdot (SAP survey), George Dyson (personal correspondence Tim O’Reilly), Doug Laney (Stackexchange), Brian Hopkins and Boris Evelson (Forrester), Bob Gourley (Smartdatacollective),  SAS,  Stephane Hamel.

  1. “Big data is a collection of data sets so large and complex that it becomes difficult to process using on-hand database management tools or traditional data processing applications. The challenges include capture, curation, storage, search, sharing, transfer, analysis, and visualization.” Cited from Wikipedia
  2. “Big data is the term increasingly used to describe the process of applying serious computing power – the latest in machine learning and artificial intelligence – to seriously massive and often highly complex sets of information.” Cited from 4/2013 the Microsoft Enterprise Insight Blog
  3. “We can safely say that Big Data is about the technologies and practice of handling data sets so large that conventional database management systems cannot handle them efficiently, and sometimes cannot handle them at all.” Cited from 1/2012 ZDNet Blog by Andrew Brust.
  4. “An easily scalable system of unstructured data with accompanying tools that can efficiently pull structured datasets.” Cited from a 4/2013 post on the FCW Blog.
  5. “The definition of big data? “Who cares? It’s what you’re doing with it,”” Cited from 3/2013 FCW article, quoting Bill Franks.
  6. “The definition of big data refers to groups of data that are so large and unwieldy that regular database management tools have difficulty capturing, storing, sharing and managing the information.” Cited from yourdictionary.com
  7. “Big Data refers to the massive amounts of data that collect over time that are difficult to analyze and handle using common database management tools. Big Data includes business transactions, e-mail messages, photos, surveillance videos and activity logs (see machine-generated data). Scientific data from sensors can reach mammoth proportions over time, and Big Data also includes unstructured text posted on the Web, such as blogs and social media.” Cited from the pcmag encyclopedia
  8. “Any amount of data that’s too big to be handled by one computer.” John Rauser cited 5/2012 at networkworld.com
  9. “To define big data in competitive terms, you must think about what it takes to compete in the business world. Big data is traditionally characterized as a rushing river: large amounts of data flowing at a rapid pace. To be competitive with customers, big data creates products which are valuable and unique. To be competitive with suppliers, big data is freely available with no obligations or constraints. To be competitive with new entrants, big data is difficult for newcomers to try. To be competitive with substitutes, big data creates products which preclude other products from satisfying the same need.”
    Cited from 9/2012 John Weathington on the TechRepublic Blog
  10. “Big data refers to a process that is used when traditional data mining and handling techniques cannot uncover the insights and meaning of the underlying data. Data that is unstructured or time sensitive or simply very large cannot be processed by relational database engines. This type of data requires a different processing approach called big data, which uses massive parallelism on readily-available hardware.” Cited from a Cory Janssen post on Techopedia.com
  11. “Every day, we create 2.5 quintillion bytes of data — so much that 90% of the data in the world today has been created in the last two years alone. This data comes from everywhere: sensors used to gather climate information, posts to social media sites, digital pictures and videos, purchase transaction records, and cell phone GPS signals to name a few. This data is big data.” Cited from IBM.com
  12. “A more pragmatic definition of big data must acknowledge that:
    Exponential data growth makes it continuously difficult to manage — store, process, and access. Data contains nonobvious information that firms can discover to improve business outcomes. Measures of data are relative; one firm’s big data is another firm’s peanut. A pragmatic definition of big data must be actionable for both IT and business professionals.The Definition Of Big Data: Big Data is the frontier of a firm’s ability to store, process, and access (SPA) all the data it needs to operate effectively, make decisions, reduce risks, and serve customers.”
    Cited from a 5/2012 Mike Gualtieri Forrester Blog post
  13. “The world has always had ‘big’ data.  What makes ‘big data’ the catch phrase of 2012 is not simply about the size of the data.  ‘Big data’ also refers to the size of available data for analysis, as well as the access methods and manipulation technologies to make sense of the data.” Cited from 12/2012 Adexchanger.com article by John Ebbert
  14. “Big data is data that exceeds the processing capacity of conventional database systems. The data is too big, moves too fast, or doesn’t fit the strictures of your database architectures. To gain value from this data, you must choose an alternative way to process it.” Cited from 1/2012 post by Edd Dumbill on O’Reilly Strata
  15. “We define Big Data as a cultural, technological, and scholarly phenomenon that rests on the interplay of:
    (1) Technology: maximizing computation power and algorithmic accuracy to gather, analyze, link, and compare large data sets.
    (2) Analysis: drawing on large data sets to identify patterns in order to make economic, social, technical, and legal claims.
    (3) Mythology: the widespread belief that large data sets offer a higher form of intelligence and knowledge that can generate insights that were previously impossible, with the aura of truth, objectivity, and accuracy.” From Critical Questions for Big Data Boyd & Crawford (2012) as cited by Leslie Johnston on the Library of Congress website
  16. “The definition of Big Data is very fluid, as it is a moving target — what can be easily manipulated with common tools — and specific to the organization: what can be managed and stewarded by any one institution in its infrastructure.  One researcher or organization’s concept of a large data set is small to another.” Cited from 10/2011 Leslie Johnston Library of Congress
  17. “Big Data is presently synonymous with technologies like Hadoop, and the “NoSQL” class of databases including Mongo (document stores) and Cassandra (key-values).” Tim Gasper cited 10/2012 on TechCrunch
  18. “Big data (also spelled Big Data) is a general term used to describe the voluminous amount of unstructured and semi-structured data a company creates — data that would take too much time and cost too much money to load into a relational database for analysis. Although Big data doesn’t refer to any specific quantity, the term is often used when speaking about petabytes and exabytes of data.” Cited from a 3/2011 post by Margaret Rouse on TechTarget
  19. “But I do like Roger Magoulas’ definition of “big data”: big data is when the size of the data becomes part of the problem.” Cited post by Mike Loukides 2/2013 post on O’Reilly Radar
  20. “Big Data: when the size and performance requirements for data management become significant design and decision factors for implementing a data management and analysis system. For some organizations, facing hundreds of gigabytes of data for the first time may trigger a need to reconsider data management options. For others, it may take tens or hundreds of terabytes before data size becomes a significant consideration.” Cited from 6/2009 Jimmy Guterman O’Reilly
  21. Big data has the following characteristics;
    1. Very large, distributed aggregations of loosely structured data – often incomplete and inaccessible:
    2. Petabytes/exabytes of data
    3. Millions/billions of people
    4. Billions/trillions of records
    5. Loosely-structured and often distributed data
    6. Flat schemas with few complex interrelationships
    7. Often involving time-stamped events
    8. Often made up of incomplete data
    9. Often including connections between data elements that must be probabilistically inferred,
    10. Applications that involved Big-data can be:
    11. Transactional (e.g., Facebook, PhotoBox), or,
    12. Analytic (e.g., ClickFox, Merced Applications). Cited from Wikibon.org
  22. “We think at the end of the day, big data is not just about analytics, it is about data-centric applications. It is about driving some experience to a customer and causing them to do things in realtime.” Paul Mauritz quoted in a 4/2013 Steven Burke article on CRN
  23. “Modern day version of Big Brother. Online searches, store purchases, Facebook posts, Tweets or Foursquare check-ins, cell phone usage, etc. is creating a flood of data that, when organized and categorized and analyzed, reveals trends and habits about ourselves and society at large.” urbandictionary.com
  24. “A new survey by SAP suggests that nearly 76 percent of executives see “Big Data” as an opportunity. However, respondents’ definition of “Big Data” varied to a considerable degree. Nearly a quarter of the 154 C-suite executives felt that “Big Data” was the technologies designed to handle the massive amounts of data swamping organizations. Another 28 percent defined “Big Data” as that flood of data itself. Still another group (19 percent) equated “Big Data” with storing data for regulatory compliance. Around 18 percent viewed “Big Data” as the increase in data sources, including social networks and mobile devices.” slashdot 6/2012 citing an SAP survey
  25. “Big data is what happened when the cost of storing information became less than the cost of making the decision to throw it away.” Tim O’Reilly quoting personal correspondence via email from George Dyson 20 March 2013, regarding Dyson’s talk at the Long Now Foundation 19 March 2013.
  26. The Big Data Landscape:
    1. Apps
      • Vertical Apps
      • Ad / Media Apps
      • Business Intelligence
      • Analytics and Visualization
      • Operational Intelligence
      • Data as a service
    2. Infrastructure
      • Analytics Infrastructure
      • Operational Infrastructure
      • Infrastructure As A Service
      • Structured Databases
    3. Technologies

    big dataDerived from an informational diagram on The Big Data Landscape

  27.  The recently updated Gartner definition also recognizes the value aspect: “Big Data are information assets with volumes, velocities and/or variety requiring innovative forms of information processing for enhanced insight discovery, decision-making and process automation.” – Doug Laney posting at stackexchange  citing his original piece outlining the 3Vs of big data now republished.Here is the original 2001 paper entitled “3-D Data Management: Controlling Data Volume, Velocity and Variety” by Laney.
  28. “Big data: techniques and technologies that make handling data at extreme scale economical.” by Brian Hopkins and Boris Evelson at Forrester 8/2011. In diagram form. big data
  29. “To date, our key message has been that it is the enterprise CTO who is responsible for defining how the term should be used.”
    Bob Gourley (who originally posted the big data definition on wikipedia) posting on smartdatacollective.com 12/2012.
  30. “A phenomenon defined by the rapid acceleration in the expanding volume of high velocity, complex, and diverse types of data. Big Data is often defined along three dimensions — volume, velocity, and variety.”  [Big Data requires] “advanced techniques and technologies to enable the capture, storage, distribution, management, and analysis of the information.”
    The TechAmerica Foundation’s Federal Big Data Commission Comprehensive Guide to Best Practices for Big Data, cited by Bob Gourley here 10/2012.
  31. “Big data is a popular term used to describe the exponential growth, availability and use of information, both structured and unstructured.
    Ultimately, regardless of the factors involved, we believe that the term big data is relative; it applies (per Gartner’s assessment)  whenever an organization’s ability to handle, store and analyze data exceeds its current capacity.”  SAS.
  32. The simplest definition of “Big Data” is “it doesn’t fit in Excel”
    from the full quote; “I have joked that the simplest definition of “Big Data” is “it doesn’t fit in Excel” – and when you think of it, it’s true for most people who wonder how to make the shift from a traditional approach to a Big Data one.”
    Stephane Hamel comment 8/2012 Big Data – What It Means For The Digital Analyst.
  33. More to follow…

Power of Customer Analytics

, ,

Power of Customer Analytics

Today’s businesses are swimming in data. But, as any swimmer knows, it’s not enough to just be surrounded by water – you have to know how to use it to your advantage. That’s where customer analytics come in. Customer analytics is the process of using data to generate insights that can improve your business, increase revenue, and drive customer retention. 


There are four main types of customer analytics: descriptive, diagnostic, predictive, and prescriptive. In this blog article, we’ll take a closer look at each one, and explore how you can use customer analytics to improve your business.


Descriptive Analytics

Descriptive analytics answer the question “What happened?”


They provide a snapshot of what has already transpired, such as how many customers made a purchase last month, what was the average order value, or how long it took for a customer to make a purchase. Descriptive analytics are important because they provide a foundation for understanding the way your customers behave. This type of data can be used to identify trends and patterns, which can be helpful in forecasting future behavior. To generate insights from descriptive analytics, businesses need to have access to data that is organized and structured in a way that makes it easy to slice and dice. This data can come from a variety of sources, such as customer surveys, website analytics, transaction records, and social media data. However, descriptive analytics cannot tell you why something happened, which is where diagnostic and predictive analytics become valuable.


Diagnostic Analytics

Diagnostic analytics answer the question “Why did it happen?”


They help you identify the root cause of an issue, such as why customers are leaving your site without making a purchase, or why orders are being delayed. Diagnostic analytics use data mining techniques to uncover relationships and identify causal factors. This type of analysis can be used to improve processes, optimize performances, and resolve problems. Diagnostic analytics can be obtained through surveys, customer interviews, focus groups, and other qualitative methods where customers can provide feedback about their experience. Alternatively, services like Opentracker can provide website data that can be used to diagnose problems so you can improve the customer experience and mitigate issues before they cause long-term damage.


Predictive Analytics

Predictive analytics answer the question “What could happen?”


Based off of historical data, predictive analytics uses statistical modeling to generate insights about future trends and behavior. This type of analysis can be used to identify opportunities and risks, make decisions about resource allocation, and develop marketing campaigns. For example, predictive analytics can be used to determine which customers are likely to churn so you can take steps to retain them, or to identify which products are likely to be popular so you can stock more of them. To generate predictive insights, businesses need data that is clean, accurate, and complete. Having a team of experts onboard who are skilled in statistical modeling is also critical for this type of analysis. In-house data scientists can be costly, which is why access to our team of professionals is included in an Opentracker subscription so we can assist you in generating predictive insights and interpreting the results as your business grows.


Prescriptive Analytics

Prescriptive analytics answer the question “What should we do?” 


It’s not enough to know what happened in the past or what could happen in the future. To make data-driven decisions, you need to know what actions you should take to achieve your desired outcome. This is where prescriptive analytics comes in. Prescriptive analytics uses optimization algorithms to identify the best course of action, given a set of constraints and objectives. This type of analysis takes into account a variety of factors, such as costs, risks, and benefits, to help businesses make decisions that are in their best interest. With the right data in your hands, you can start to develop prescriptive analytics solutions that will allow you to automate decision-making and improve your overall efficiency.

No matter what type of business you have, customer analytics can be a powerful tool for driving growth and success. By understanding the different types of customer analytics and how you can use them, you can make better decisions, improve your operations, and move your business forward.


Opentracker offers a suite of tools and services that are designed to be user-friendly and scalable so businesses of all sizes can benefit from data-driven decision-making. We help you automate your customer journey reporting, uncover actionable insights, and make better decisions that drive real results. With direct access to our data analytics team, a dedicated customer success agent, and a dedicated database engineer, you can be sure that you’re getting accurate, actionable data you need to grow your business. 


Book a discovery call today to learn more about how Opentracker can help you turn data into insightful, actionable customer intelligence. 

A sneak peak at increasing sales by 30% and much more

A sneak peak at increasing sales by 30% and much more

From time to time, every CFO or HR personnel has had to answer a perplexing question: What is the ROI here? Am I getting the best bang for the buck?

There’s a lot Big Data can do: It can help organizations shore up their bottom lines by helping them review the performance of their departments, gauge the outcomes of their services, track loyalty of their customers and even help weed out non-performing human resources.

Here’s a look at hard numbers on what it means for manufacturers, retailers and pretty much anyone who has a company to run.

Cutting costs and keeping your organisation lean using Big Data

An early adopter of the technology, Germany’s Federal Labour Agency or ‘’BA’’ in short, is tasked with the finding jobs and providing support services for the unemployed.

Armed with a 54 Bn budget and 1,00,000+ employees, it has cut more than €10Bn in costs by employing big data strategies by identifying and eliminating inefficient programs, creating new targeted programs and pitching them to segmented audiences and helping disseminate and adopt best practices.  

Image Source:  Mckinsey Report

Surveys reveal that customers of BA highly appreciate the relevance and efficiency of their services. No matter the size or type of organisation, understanding where to direct your resources is crucial to profitability and the continued market-viability of any organisation.

Image source: Mckinsey Report

The above image illustrates the savings accrued in the form of increased tax collection, detection of fraud and increased operational efficiency by deploying Data Analytics. Such gains are achievable and relevant even for private businesses.

Government’s, NGO’s and businesses can all build capabilities that allow them to deploy Data Analytics to make better sense of how their resources are utilised and how well they connect with their target audience.

Data Analytics can successfully lead innovation in your company. 

Launching a new product or service always carries with it a high up-front cost in terms of time and money spent on recruitment, R&D, product development, marketing & publicity and other costs. Sometimes, with millions invested and the survival of the company at stake, here’s how some companies are using Big Data to get it right.

Pramad Jandhyala, co-founder of LatentView, had this to say,’’ Earlier, a food company would go to panel of chefs or focus groups to see what product to launch. In that model, people didn’t tell you anything until you asked a question. Now, you don’t ask any questions, only study trends.

Tapping the power of social media and data analytics, her firm helped a client decide to start a restaurant in favour of flavours from Peru, Thailand, Korea and Nepal.

She added,’’We listened in on social media conversations around which restaurants people ate at, their recommendations etc. Now companies want to see what they can learn from what people are saying rather than merely understand if they are saying good or bad things about a product’’. 

Understanding and capitalizing on trends is important to stay ahead of the game. Introducing the right product at a wrong time or marketing incorrectly to the wrong customer-set is a sure-shot way to burn cash.  

Lesson to learn? Simple: Your customers are leaving digital clues. Learn to read them.

What do the experts have to say on this?

Image Source: Mckinsey Report


Every single figure in the above image stands as a business opportunity for avenues of growth.

A  Mckinsey Report explained, ‘’Big data can help manufacturers reduce product development time by 20 to 50 percent and eliminate defects prior to production through simulation and testing. Using real-time data, companies can also manage demand planning across extended enterprises and global supply chains, while reducing defects and rework within production plants’’.


Notice, (in the above image), how costs can be slashed and revenues shoot up, regardless of where Big data is deployed in the value-chain.

In sectors like retail, some retailers like Wal-Mart have developed the capacity to mine petabytes of data on customer preferences and buying behavior, giving them the leverage to win important pricing and distribution concessions from consumer product goods companies.

The report went on to add that, ‘’Retailers across the industry are becoming more sophisticated in slicing and dicing big data they collect from multiple sales channels, catalogs, stores, and online interactions. The widespread use of increasingly granular customer data can enable retailers to improve the effectiveness of their marketing and merchandising’’.


Did you know? Here are 3 real-life examples of increasing revenue using data mining.


1. Amazon.com employs Data Analytics to generate “you might also want” prompts for each product bought or visited. At one point, Amazon reported that 30 percent of sales were due to its recommendation engine. Another example of this lever is using big data analyses to optimize in-store promotions that link complementary items and bundled products


2. Location-based marketing targets consumers who are close to stores or already in them. For instance, as a consumer approaches an apparel store, that store may send a

special offer on a sweater to the customer’s smartphone.


The startup PlaceCast claims that more than 50 percent of its users have made a purchase as a result of such location-based ads. Nearly 50 percent of smartphone owners use or plan to use their phones for mobile shopping.


3. Retailers can use big data to integrate promotions and pricing for

shoppers seamlessly, whether those consumers are online, in-store, or perusing a

catalog.


Example, Williams-Sonoma has integrated customer databases with

information on some 60 million households, tracking such things as their income,

housing values, and number of children.


Targeted e-mails based on this information obtain ten to 18 times the response rate of e-mails that are not targeted, and the company is able to create different versions of its catalogs attuned to the behavior and preferences of different groups of customers.

Source: Mckinsey Report


Use Data to your advantage!


 We help firms, of all sizes, unlock their potential by helping them adopt big data strategies.


Click here for a zero-cost, risk-free trial or get an absolutely free – no strings attached- consultation with one of our experts