Weekly trends

traffic

Description

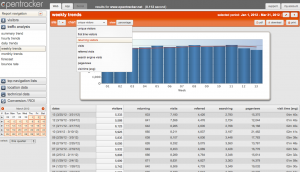
Chart variables over time to be displayed on graph and table. Variables which can be charted are: unique visitors, first time visitors, returning visitors, visits, referred visits, search engine visits, pageviews, and visit time (avg). The drop-down for charting variables is located in the Options bar (indicated with a wrench icon), along with the ability to make PDF, print or download .csv.
Date range is managed using the calendar.
The table (below) highlights the selected/ charted variable with a white column background.
Select between displaying absolute numbers of percentages.

Definition

Traffic over time per week (7 day units). Chart variables over time. Available in graph and table form. Set date range to one week period or 12 months, etc., as needed.

Functions & Features

Weekly trend graph Traffic through time with selected variable to chart. Variables available for charting: unique visitors, first time visitors, returning visitors, visits, referred visits, search engine visits, pageviews, visit time (avg).
Weekly trend table The table includes columns which display: dates unique visitors returning visitors visits (total number of visits generated by all visitors) referred: visits which came through a 3rd-party referrer searching: visits coming through search engines with search terms pageviews: number of events/clicks/pageviews per day visit time (avg): indication of traffic quality, in terms of use- and visit time

Screenshot(s)

Weekly trends
Copyright © 2024 Opentracker. All rights reserved.