Description
Technical data >> Browsers
Use the Browsers report to see which Browsers are the most popular for accessing your site. This report also gives you a breakdown by Browser version.
This is useful because the report will allow you to test and optimize usability for your users and visitors per browser version.
By knowing which version your users are accessing, you can be one step ahead for delivering an optimal experience.
This report lists all known Browsers and versions through which people visited your site or app.
Using the calendar, you can select any date range required. The date range is then displayed top right in the Options bar as the ‘selected period’.
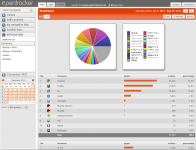
The columns in the table are; No., Browser, Graph, Visitors, Percentage.
While a typical Browsers report will look like this in terms of entries;
Chrome
Firefox
IE
Safari
Unknown
Mozilla (Gecko)
Mozilla
Android browser
null
Opera
Netscape
The second table, which speficies versions typically looks like this;
Firefox 14.0.1
Chrome 21.0.1180.89
IE 8.0
Chrome 20.0.1132.57
Firefox 13.0.1
Firefox 15.0.1
Chrome 21.0.1180.83
Chrome 20.0.1132.47
Safari 5.1
Firefox 15.0
Firefox 12.0
Unknown
Chrome 21.0.1180.75
Safari 5.1.7
Safari 6.0
IE 7.0
Chrome 22.0.1229.79
Firefox 11.0
Safari 4.0
Chrome 19.0.1084.56
Firefox 14.0
Firefox 13.0
Firefox 9.0.1
Firefox 10.0.2
Firefox 16.0
Chrome 21.0.1180.82
Chrome 19.0.1084.36
Chrome 21.0.1180.57
Chrome 21.0.1180.77
Firefox 8.0.1
Firefox 10.0
Firefox 7.0.1
Chrome 18.0.1025.168
Mozilla (Gecko) 5.0
Safari 5.0
Firefox 3.6.28
Mozilla 5.0
Android browser 4.0
Definition
The Browsers report displays all visits to your site filtered by Browser and is further filtered within Browser by Browser version.
The lower/ underneath Browser table identifies and specifies individual browser versions, for example IE 9.0, Firefox 14.0.1, Chrome 21.0.1180.89, etc.
Visually, the report is made up of a list of all Browsers from which visits were identified, in order of popularity.
The information is displayed in both a pie chart graph and two tables.
Please note that there are two tables for this report; the first table is grouped by Browser, and the second by Browser version, so that you can drill-down within the Browser report and identify versions, see screenshot below for details.