Introduction To Customer Churn
“Customers don’t use more than three months with us; what’s happening?”
“Wow … there was a 70% drop in our daily average usage yesterday.”
“95% of visitors on our checkout page yesterday didn’t convert; why?”
“Why do 20% of my new users always cancel after one month?”
If you ask yourself any of these questions, you need to run a customer churn analysis. Call it user churn analysis, churn analytics; it’s all the same.
Customer churn analysis is the process of analyzing why users leave your product, software, or business. Period. Reducing churn by 5% can increase profits by 25-125%.
But what causes customer churn?
Or why do customers, users, and subscribers leave? Several things are the culprits. And your business might have unique factors that cause it. You need to find out why customer churn is happening and make it stop.
Here’s how to run unique customer churn analysis for your business and find the reason(s) why customers leave. If you want experts to do the heavy analytics lifting for you, get in touch with us; we can help. At the end of this article, you can apply for a free consultation session.
4 ways to run customer analysis for your specific business
Bad customer experience is the No.1 reason most customers leave; 68% of them leave because they think a company doesn’t care about them.
When they don’t get a good (great, actually) experience with your business, they switch to your competition.
And it’s okay when customers leave, but it becomes bad when too many of them leave too frequently. That’s bad churn, which could cripple any business. So use these four customer analysis methods to show when you have tolerable or intolerable churn:
1. Know the right KPIs to track
First, you need to know which KPIs inform you about churn. This will let you know your churn rate and determine whether it’s tolerable or not. Essentially, you need to monitor these four key KPIs to analyze churn:
i. Gross customer churn rate:
The rate at which customers leave your business daily, monthly, quarterly or yearly.
The formula: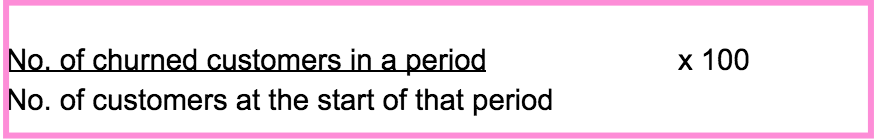
You could calculate your churn on a cohort basis, that is, calculating churn based on a group of customers. For example, you can calculate how many of your software trials in January left before February, March or whatever month. Or how many of the customers who booked a one-way ticket the last Christmas booked a return ticket in January, February or some other month.
A tolerable churn rate is generally <12.30%, but a nice sweet spot is anything around 5%.
ii. Net customer churn rate:
The difference between the rate of customer acquisitions vs the rate of cancellations.
The formula: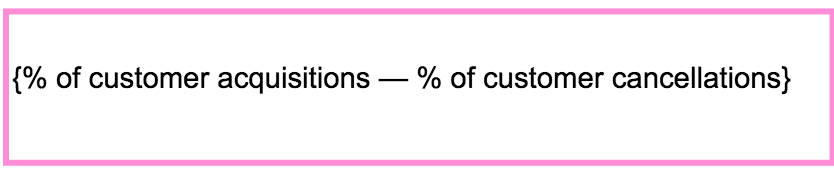
If the result turns out negative, it means you have more activations than deactivations (cancellations), which is great. But if the result is positive, then you have more cancellations than customer acquisition — which is unhealthy churn.
iii. Daily average usage (DAU):
The rate at which users engage with your product, website or software every day. It’s a great indicator of customer engagement.
For instance, if your DAU keeps getting lower and lower for seven days, then there’s probably a glitch or bad customer experience you need to fix somewhere to stop such an unhealthy churn rate.
iv. Weekly and monthly average usage (WAU and MAU):
The rate at which users interact with your product every week (WAU) or every month (MAU). Like DAU, an ascending WAU or MAU means your customer experience is good, and a descending weekly/monthly usage means you’ll need to work on your customer experience before your churn rate gets too bad.
So if your product is one that customers should typically engage with every day, week or month, find why that’s not happening (if, of course, it’s not) and correct it. That’s the first step.
But of course, it’s not that simple. You need to know factors that could cause your average usage rates to drop — and that leads to our next point.
2. Utilize a qualitative analysis tool
If you find your churn rate to be unhealthy (i.e. above 12.3% in a week, month … whatever applies to you), then you need to find the pet peeves causing your customers to leave.
And you’ll need one or more qualitative analysis tools for that. These tools will typically show you how and why customers are taking specific actions on your software.
So, while a quantitative analysis tool like Google Analytics shows you the who, why, where, and how many of things happening on your software, qualitative analytics tools show you how and why those things happen.
For example, a qualitative analysis tool like Opentracker helps you see the entire history of each of your users with your website or app. This means you can trace the journey of people who land on your payment page and optimize it for better engagement.
Simply search “pay” in the tool and you’ll see a list of visitors who landed on your checkout page — from the most recent to the oldest visitors. Learn more about this feature here.
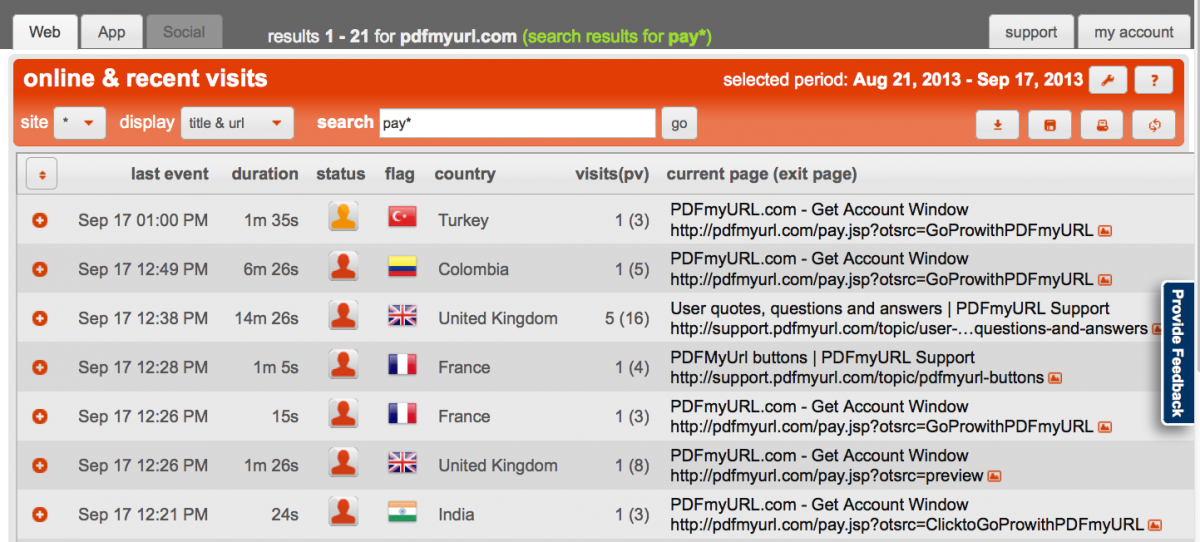
Sample of a universal search; locate everyone who landed on the payment page.
This tool gives you an entire story of how visitors land on your site and where they go from there. If someone lands on a page from a referral or ad, for instance, you know exactly where they come from. And if they go from there to your pricing page or about page, you know which page people from specific referrals like to visit.
All that data helps you optimize your product or service for better retention. You know the exact pages to optimize (add video, improve copy, etc.) to increase engagement, which helps you reduce churn.