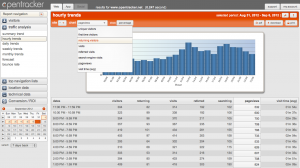
Description
Chart varibales over time to be displayed on graph and table. Variables which can be charted are: unique visitors, first time visitors, returning visitors, visits, referred visits, search engine visits, pageviews, and visit time (avg). The drop-down for charting variables is located in the Options bar (indicated with a wrench icon), along with the ability to make PDF, print or download .csv.
Date range is managed using the calendar.
The table (below) highlights the selected/ charted variable with a white column background.
Note: if a period of more than 24 hours is selected, the results shown are sum-totaled of hours over selected days.
Definition
See traffic over time broken into one hours units. Chart variables over time. Available in graph and table form. Set date range to one 24 hours period or 7 day periods, etc., as needed.